Educational Resource
Read More
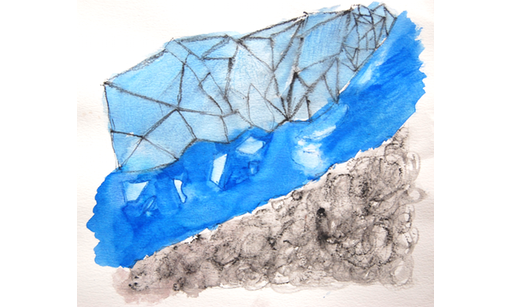
Illustrated Graphs: Using Art to Enliven Scientific Data
Create an illustrated graph using real scientific data, and write an artist’s statement to explain your thinking. Try it with climate change!
