Grade Level
6 - 8
minutes
15 min - 1 hr
subject
Mathematics
Activity Type:
scientific method, experimental design, variation
If you’ve ever sucked on a lollipop, you’ve probably noticed how the candy surface gradually gets smoother and the lollipop itself gets smaller and smaller as you lick it. What’s happening in your mouth is a great model for what happens to other things that erode over time, like rocks, glaciers, and even pills and bones.
By studying something as simple as how a lollipop dissolves, scientists and mathematicians can better understand weathering and erosion in hard-to-view places like the Antarctic and human stomachs. But studying the dissolution of a lollipop is not as easy as it sounds. To see how the applied mathematics lab at NYU tackled lollipop dissolution, watch the Science Friday video “The Lollipop Hypothesis:”
The Challenge
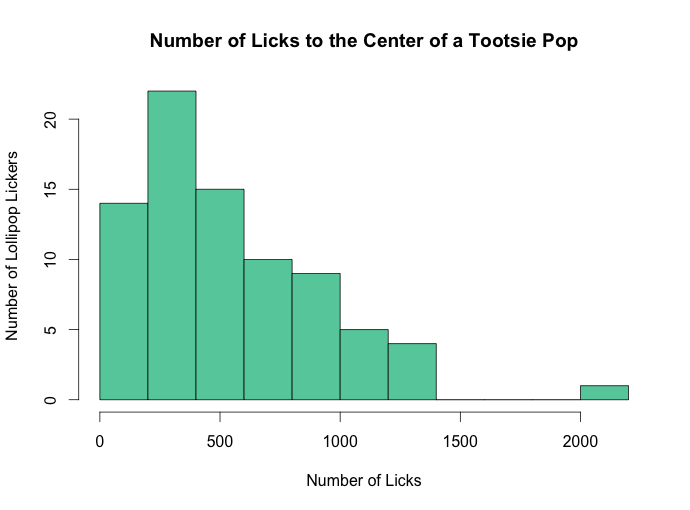
Go ahead, download the validated lollipop licker data yourself, and do your own data analysis!
Why were the number of licks so variable?
- Figure out ways our lickers and their lollipops might have differed from one another.
What differences could exist between different lickers and their lollipops, and how might those differences result in wildly different numbers of licks to the center of a Tootsie Pop? - Evaluate our lollipop licking experimental procedure.
Science Friday asked its lickers to lick a Tootsie Pop and report how many licks it took. How could our procedure be improved so that our results are more consistent? - Design a better lollipop-licking experimental procedure.
Write and test your own lollipop-licking procedure—one that does a better job at preventing differences between lickers and lollipops from creating variation in the results.
Materials
A lollipop for every experimenter
Some paper
A pencil
1) What is different about different lickers and their lollipops?
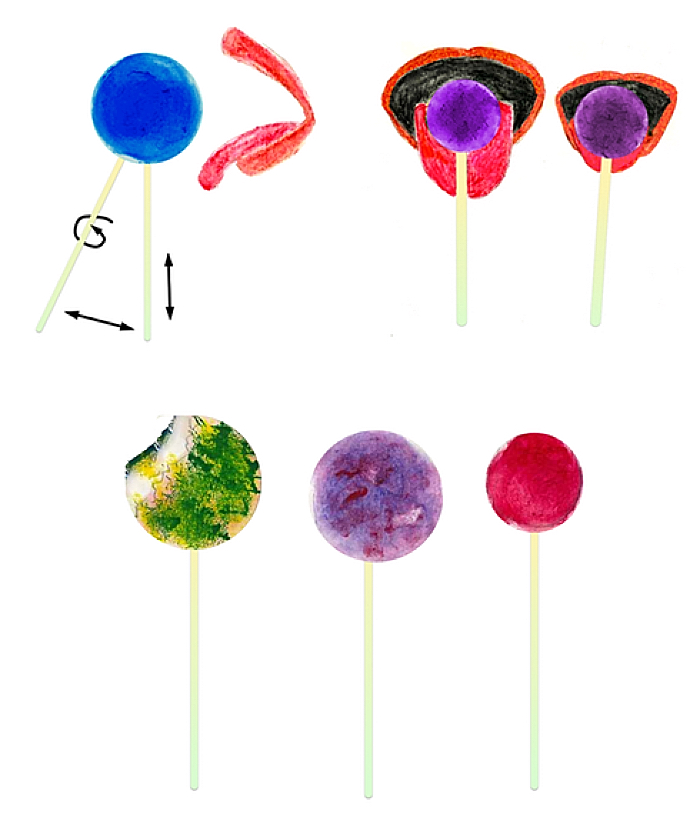
Why would it take some people so many licks to reach the center of a Tootsie Pop while other people needed so few? Make a list of all the ways that licking a lollipop could vary, or be different, between lollipop lickers. For each difference, try to predict how it would change the number of licks it took someone to get to the center of a Tootsie Pop.
To give you a jumpstart, here are some visual hints of ways that lickers might be different from one another and a Lollipop licker differences table for you to organize your thoughts.
2) What was wrong with our lollipop licking procedure?
With all the ways that lickers might be different, it’s no wonder there was so much variation in the number of licks it took different lickers to get to the Tootsie Roll center of a Tootsie Pop!
A good experimental procedure is specific enough that no matter when or where the experiment takes place, and no matter who conducts it, the results will be more or less the same. Whether or not an experiment can be “replicated” by other researchers is often a test of how well the procedure is written.
Carefully consider the procedure that we used to get our lollipop licking results, below. What could we do to make the procedure more specific so that the results would not differ between lickers? Use the third column of your licker differences table to record ways to modify the procedure to prevent each difference from impacting the results.
1. Select your favorite flavor of Tootsie Pop. (We take no responsibility for any blue tongues.)2. Unwrap Tootsie Pop. (This is critical. Do NOT skip this step.)3. Gently apply tongue to unwrapped Tootsie Pop.4. Count each lick. (This can be done out loud or using pen and paper.)5. Repeat steps 3 and 4 until you see and feel the center of the pop, which is whenever you reach the Tootsie Roll.6. Come back here and tell us how long it took.”

3) Write and test a better lollipop licking experimental procedure.
Now it’s your turn. Write a better lollipop-licking procedure to see how many licks it takes to get to the center of a Tootsie Pop. Make sure your procedure is as specific as possible and can be easily repeated by other lollipop experimenters.
When you think your procedure is ready, test it over a few days, or get a group of friends together to try it out and tell you how many licks it took to get to the center of a Tootsie Pop. Did you see a range in results as wide as Science Friday’s (between 100 and 2000 licks), or were your results less variable? How do you think the variation in your results would change as you asked more and more people to participate in your lollipop-licking experiment? Do you think your experimental procedure could ensure that all lollipop lickers were exactly the same, or could some differences still exist?
What is up with all of this lollipop-licking variation?
In this experiment, one example of a variable could be licker tongue size. If tongue size varied between lollipop lickers, those with bigger tongues might need fewer licks to get to the chewy center than those with smaller tongues. Another licker variable could be whether or not the lickers nibble and bite at the lollipop before they’ve reached the center.
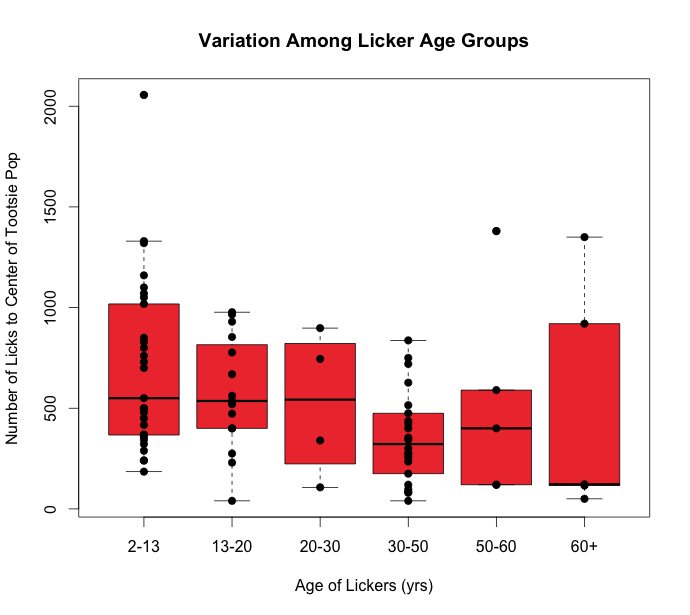
But the number of licks it takes to get to the center of a Tootsie Pop is also a variable. And sometimes, one or more variables can cause variation in other variables. If you look at the graph of the number of licks it took Science Friday fans to get to the center of a Tootsie Pop, there is a great deal of variation. As you probably figured out, differences between lickers and their lollipops probably caused the variation in the number of licks to the center of a Tootsie Pop.
Scientists typically design experiments to focus on a single variable at a time and try to prevent other variables from affecting the results of their experiments by writing procedures that control for unwanted variables. Controlling for a variable means that you prevent it from causing variation in the results of the experiment, usually by forcing it to be the exact same every time you do the experiment. For example, in this experiment, the variable you are focusing on as a result is “number of licks.” If you wanted to write a lollipop-licking procedure that prevented the “licking direction” from causing variation in your results, you could control the licking direction variable by specifying that the licker should only lick straight from the bottom of the lollipop to the top. What variables did you control in the procedure that you wrote?
Standards
Next Generation Science Standards:
Planning and Carrying Out Investigations
(Grades 6-8)
- Conduct an investigation and/or evaluate and/or revise the experimental design to produce data to serve as the basis for evidence that meet the goals of the investigation.
- Evaluate the accuracy of various methods for collecting data.
- Collect data to produce data to serve as the basis for evidence to answer scientific questions or test design solutions under a range of conditions.
Common Core Standards:
CCSS.MATH.CONTENT.6.SP.A.1
Recognize a statistical question as one that anticipates variability in the data related to the question and accounts for it in the answers. For example, “How old am I?” is not a statistical question, but “How old are the students in my school?” is a statistical question, because one anticipates variability in students’ ages.
CCSS.MATH.CONTENT.6.SP.A.2
Understand that a set of data collected to answer a statistical question has a distribution which can be described by its center, spread, and overall shape.
CCSS.MATH.CONTENT.6.SP.A.3
Recognize that a measure of center for a numerical data set summarizes all of its values with a single number, while a measure of variation describes how its values vary with a single number.
Student objectives
Educator's Toolbox
Meet the Writer
About Ariel Zych
@arieloquentAriel Zych is Science Friday’s director of audience. She is a former teacher and scientist who spends her free time making food, watching arthropods, and being outside.
