Grade Level
6-12
minutes
15 min - 1 hr
subject
Earth Science
Activity Type:
climate change, conservation, analyze and interpret data, corals
 This is a part of Oceans Month, where we explore the science throughout the world’s oceans and meet the people who study them. Want to dive in with us? Find all of our stories here.
Most people are familiar with the growth rings seen in tree cross-sections, but few are aware that similar growth patterns are visible in skeletons of reef-building corals. This activity will introduce students to these growth patterns and what they can tell us about the environment in which the corals live.
Students will be able to:
- Describe growth patterns in reef-building coral skeletons.
- Determine an annual growth average for a particular coral skeleton.
- Identify potential impacts to coral growth.
- Use existing data to estimate for missing data.
- Compare coral colony size at the time of specific historical events.
Background Information
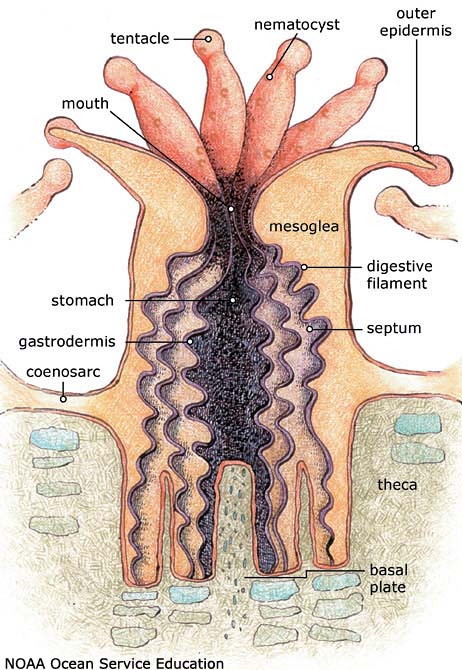
Coral polyps are soft-bodied animals related to anemones and jellyfish. Their tube-like bodies are closed at one end. A mouth opening at the other end is surrounded by flexible, stinging tentacles.
Coral polyps within a colony are genetically identical and situated in close proximity to one another, with each polyp joined to the ones beside it. Beneath this thin layer of living tissue at the top of a coral colony, the polyps of reef-building corals create hard layers of calcium carbonate. This is what we consider the hard, or
stony, part of the reef. This is the coral skeleton.
As coral colonies grow, new layers of skeleton are deposited. The amount of growth in coral skeletons is determined by variations in temperature and other weather conditions.
At Flower Garden Banks National Marine Sanctuary, in the northwestern Gulf of Mexico, scientists have determined that coral skeletons tend to grow more rapidly in fall and winter months, when temperatures are more moderate (72-77F= 22-25C). This creates less dense growth in the skeleton, while slower growth rates in summer create higher density skeleton. The result is an identifiable series of growth bands in coral colonies, much like those observed in trees. Historical temperature data for the sanctuary can be found here.
In order to see these layers, scientists drill cores out of established coral heads. This gives them a
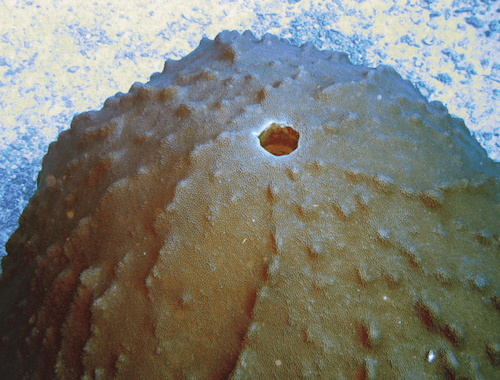
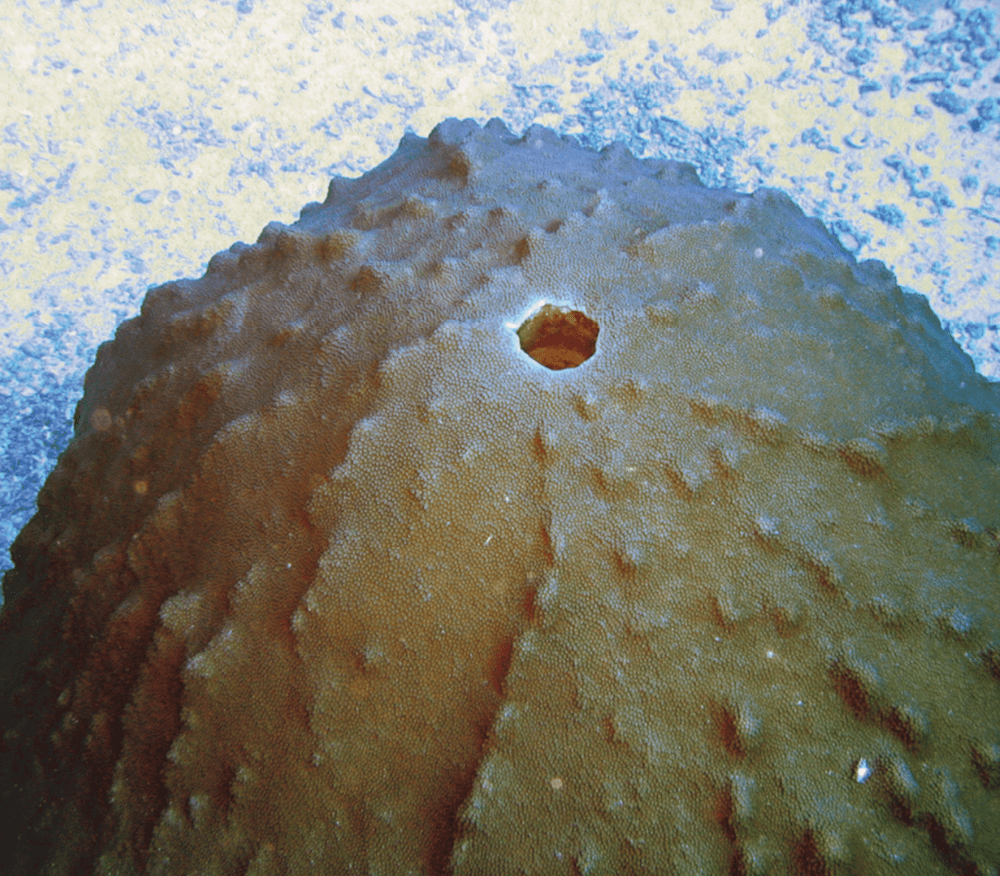
look at years-worth of layers in one compact unit. The larger the coral colony, the more years of data they can extract. In Flower Garden Banks National Marine Sanctuary there are many large coral colonies, some as big as small cars. This means that there is potential for a lot of data.
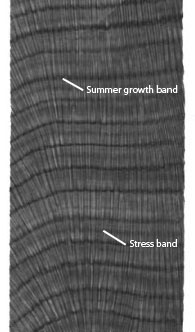
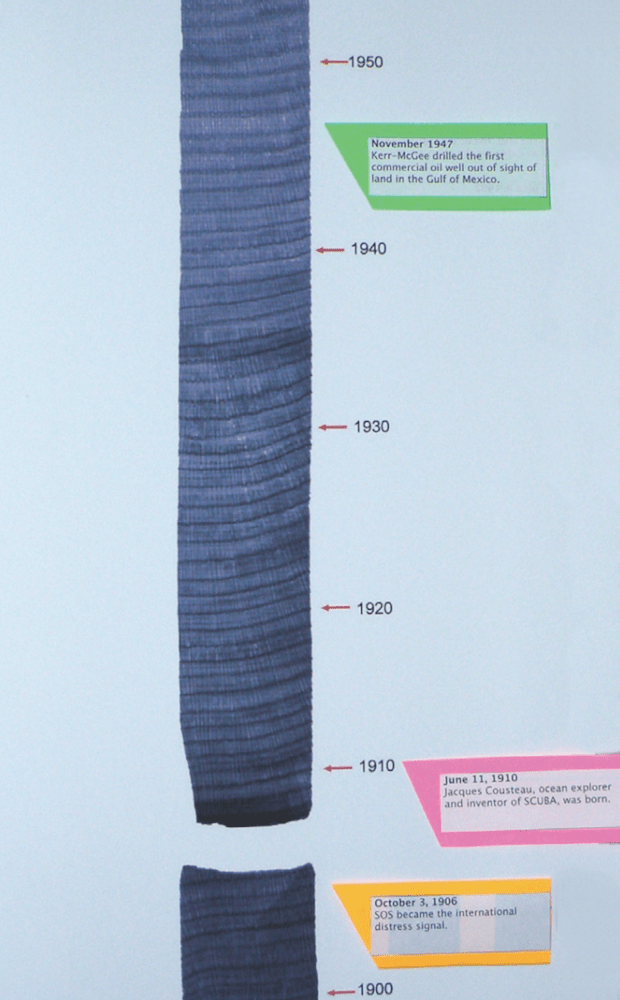
X-rays of coral cores allow scientists to examine the annual growth bands in reef-building corals. Dark bands show the slow, high-density growth that takes place during the summer. Lighter bands show the faster, low-density growth that takes place during the winter.
Scientists can take a look back in time to determine when temperatures were warmer or cooler, by simply examining the depth of each growth band. Larger low-density bands indicate warmer winter temperatures. Slightly darker bands, known as stress bands, indicate periods of environmental stress, such as temperature extremes.
Within each band scientists can also evaluate the chemical content to learn more about atmospheric conditions. By drilling out 12 tiny samples from each growth band, they can examine the oxygen and carbon isotopes to determine specific temperatures during each month of the year.
In 2005, coral core samples were taken from several colonies of Orbicella faveolata (the black and white x-ray image below). It became a federally threatened (IUCN Endangered) species of star coral in 2014, at East and West Flower Garden Banks.
Scientists from Texas A&M University are analyzing these core samples to identify patterns in growth over periods of time. They will then compare these to what we know of air and water temperature readings in the region. This information can then be used to help them evaluate cores that go back farther than recorded weather data, and “read” climate history.
Why do we want to do all of this? Understanding how climate change has affected the Gulf of Mexico over a period of years, decades, or even centuries may help us recognize and anticipate future climate changes, so that we can appropriately manage our marine resources.
Materials
- Coral Core x-ray image
- Poster adhesive
- Metric rulers (1 per student)
- Yarn or string
- Tape
- Date Cards
Preparation
- Cut apart the four core images, then copy and enlarge them. To create life size images you will have to double the size of each core. Display the core images on the wall, one above the other, to create one continuous core.
- Copy and cut apart the Date Cards you wish to use, or create your own.
Procedure
- Have students examine the images and identify the summer growth bands. These are the denser, darker bands caused by slower growth.
- Have students identify the winter growth bands. These are the lighter, less dense areas.
- Starting at the top of the core, have students label the very first dark band as 2005.
- Have students count back and label every 10 years on the core. How many years are represented by this coral core sample?
- Have each student select a 10-year span and measure the depth of each growth band within that decade, to the nearest millimeter. What is the greatest depth? Least depth? Average depth? What does this tell them about temperature change in that decade?
- Have students identify any stress bands within that decade then research what kinds of stressors might cause these.
- Assuming that the coral core is incomplete by about 50 years, have students calculate the likely height of the missing section (the oldest part). Reposition the core image so that the bottom of the core sample is that far above the floor. Use yarn or string to create the outline of a coral head from the bottom of the core image to the floor.
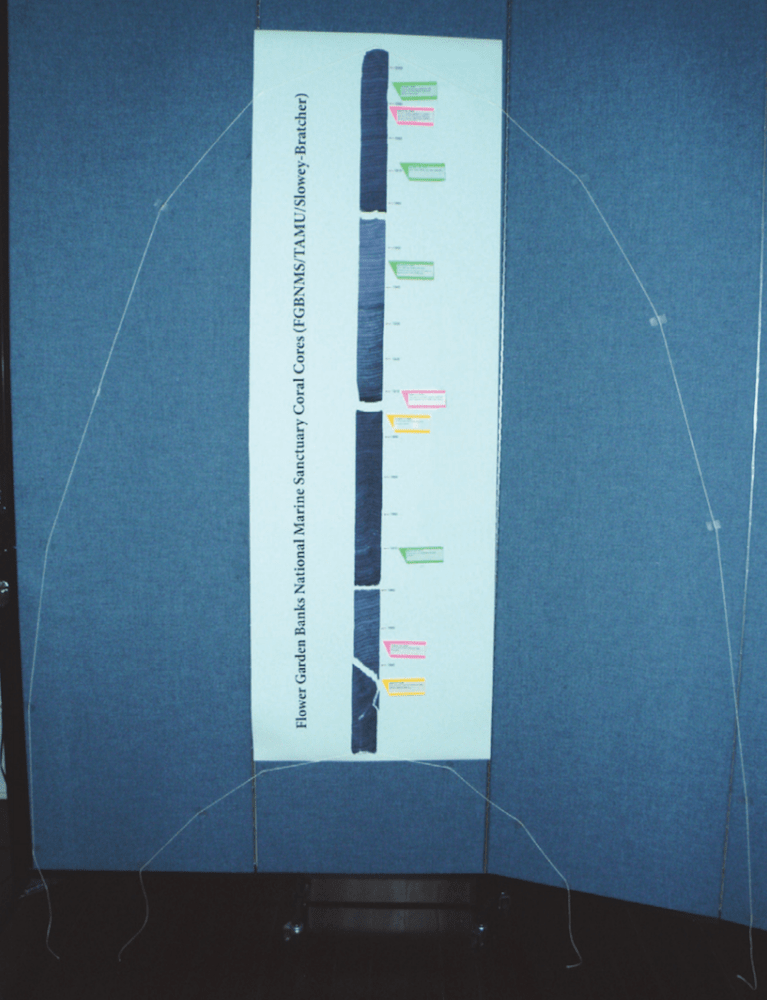
- Using the same assumption as above, have students calculate the likely height of the coral colony at the time the core sample was taken. Create an outline of a coral head from the top of the core image to the floor, remembering that corals grow out as well as up. Compare the change in size over the lifespan of the coral colony.
Extending The Lesson
- Lay Date Cards face down on a table.
- Have each student select one of the Date Cards and match it to the corresponding year on the coral core image. Attach the card near the appropriate growth band.
- Have each student measure the approximate height of the coral head at the time that event took place.
- Discuss with students the events and world changes that have occurred during the lifespan of that coral head. Are any of these events likely to have affected the corals of Flower Garden Banks National Marine Sanctuary?
Additional Notes
The coral core images in this activity are x-rays of a Orbicella faveolata core taken from Flower Garden Banks National Marine Sanctuary in 2005. These images are consecutive, from left to right, and account for the entire core sample.
You will notice there are some breaks in the sample. These occurred while attempting to extract the core from the coral head. This might lead to a discussion on the difficulties of doing this kind of work. Scientists don’t always get to work with “perfect” samples.
The small arrows that you see next to the core sample on the far right indicate high-density growth bands from the years 1860, 1850 and 1840. You can use these as reference points to help check your students’ work.
Vocabulary
Calcium Carbonate: A white crystalline compound that occurs naturally in coral skeletons and mollusk shells, as well as limestone and marble. Used to manufacture cement. Chemical symbol CaCO3.
Colony: A group of the same kinds of animals living together.
Density: A measure of a compactness of a substance.
Paleoclimatology: Study of climatic conditions in the geologic past using evidence found in geologic records such as coral skeletons, sediments, etc.
Polyp: An animal with a cylindrical body and a mouth opening surrounded by stinging tentacles. The end opposite the mouth is attached to a hard surface.
Related Links
For More Information
Education Coordinator
Flower Garden Banks National Marine Sanctuary
4700 Avenue U, Building 216
Galveston, TX 77551
409-356-0382
409-621-1316 (fax)
flowergarden@noaa.gov
https://flowergarden.noaa.gov
Acknowledgements
This lesson was developed by NOAA’s Flower Garden Banks National Marine Sanctuary. Technical information was provided by researchers Niall Slowey and Amy Bratcher at Texas A&M University.
This lesson is in the public domain and cannot be used for commercial purposes. Permission is hereby granted for the reproduction, without alteration, of this lesson on the condition its source is acknowledged. When reproducing this lesson, please cite NOAA’s Flower Garden Banks National Marine Sanctuary as the source, and provide the following URL for further information: https://flowergarden.noaa.gov.
Educator's Toolbox
Meet the Writer
About NOAA’s Flower Garden Banks National Marine Sanctuary
@fgbnmsFlower Garden Banks National Marine Sanctuary is one of 15 federally designated underwater parks protected by NOAA’s Office of National Marine Sanctuaries. Located in the Gulf of Mexico, the sanctuary is home to beautiful, healthy coral reefs about 115 miles off the Texas/Louisiana coast.
