Unfolding Stories In Maps Of The Grand Canyon
View historic maps of the Grand Canyon that tell tales of exploration of the national park.
When you open a map, you might be looking for the simplest route to get from point A to point B. But there is much more beyond the lines and landmarks. For a geographer or cartographer, a map unfolds a story. They are intricate tapestries that can depict economical, political, and even cultural patterns of a region.
“You can get lost in looking at patterns and shapes—they’re just captivating,” says Matthew Toro, director of Maps, Imagery, and Geospatial Services at Arizona State University’s library. “All of these maps are really just layers of data packaged onto paper, and of course paper isn’t the only medium that maps can be produced. Increasingly maps are digital and born digital.”
At the Map and Geospatial Hub, Toro studies all kinds of maps—from web-based interactives to physical charts—to understand social and environmental issues, such as trends in population demographics of urban areas, sea level rise, and the history of exploration. He and his team at ASU are currently digitizing and cataloging hundreds of maps of the Grand Canyon in celebration of the national park’s centennial.
“When you start to appreciate what goes into making maps, there’s an entire scientific intellectual lineage of admirable explorers who risk their lives just to collect raw data about where things are,” he says.
Take an up-close look of these historic maps of the Grand Canyon and the American Southwest below. You can click on the links in the captions in any of the maps to view them in high resolution.
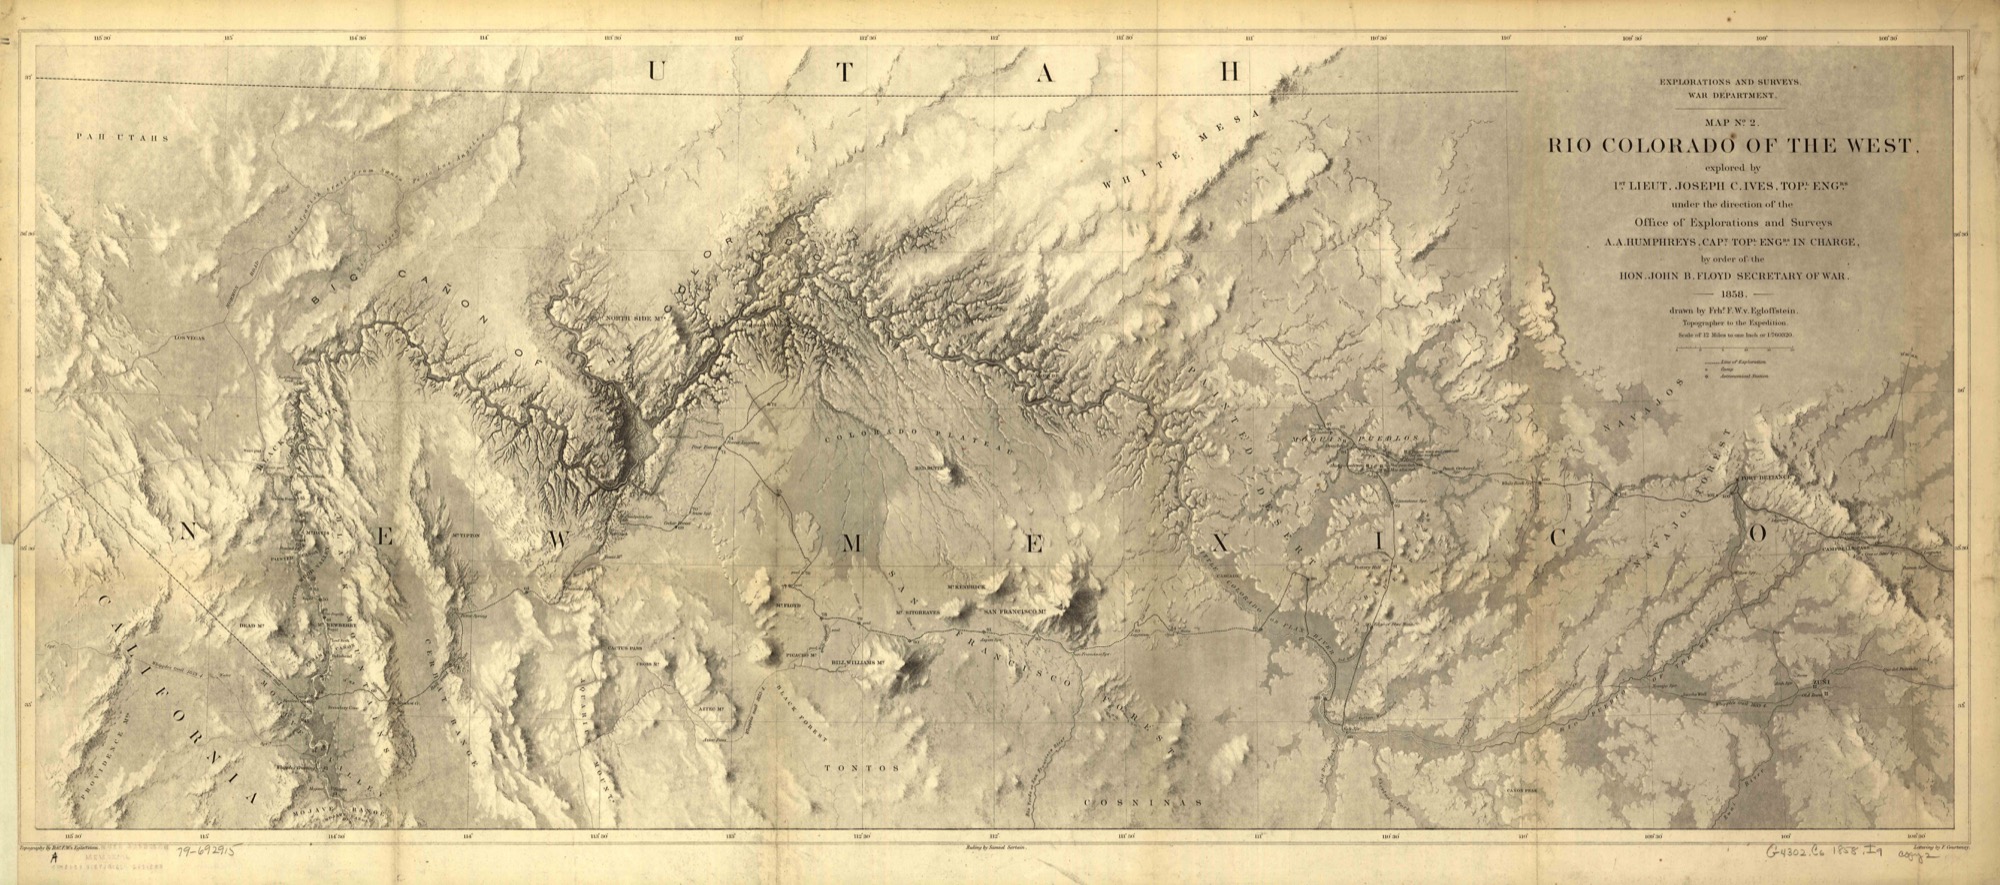
This 1858 relief map of the Colorado River is one Toro’s favorites, and it played an important role in early maps of the Grand Canyon. It was produced during Lieutenant Joseph Christmas Ives’s scientific steamboat expedition up the Colorado River in 1857 to 1858. Using shading instead of hachure marks, you can clearly see the different elevations of the terrain. “Rio Colorado of the West,” by F.W. von Egloffstein. Credit: Library of Congress, Geography and Map Division. Click through to see in high-resolution.
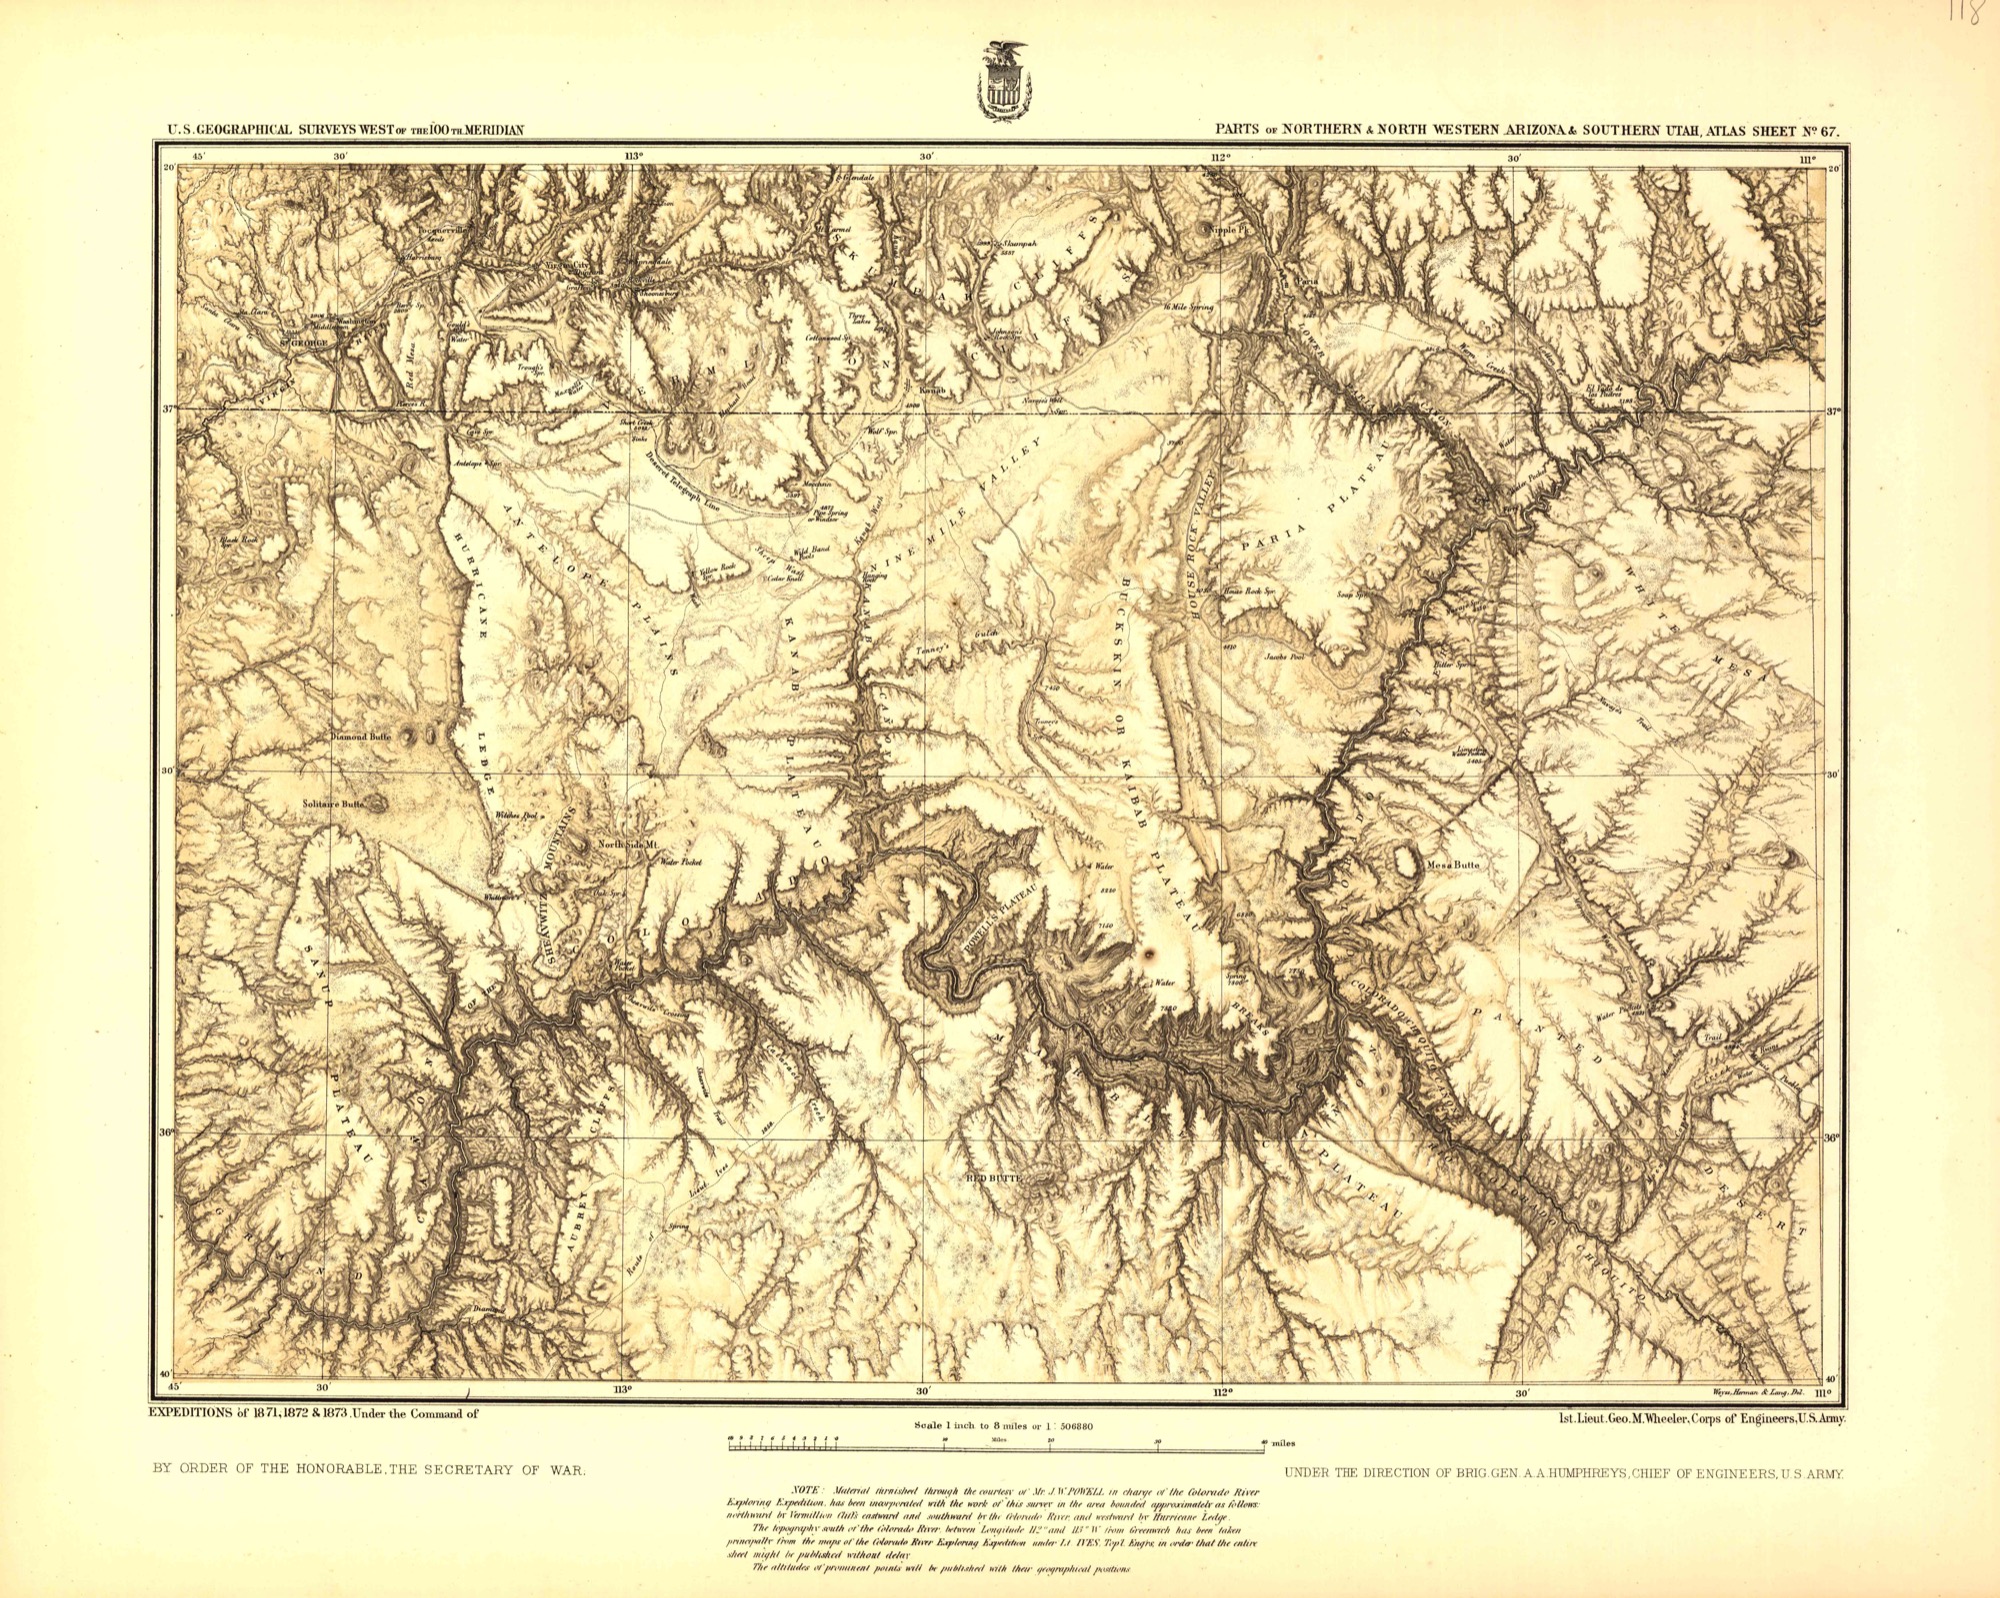
“Parts of Northern and North Western Arizona and Southern Utah,” by the U.S. Geological Survey in 1873. Credit: Library of Congress, Geography and Map Division. Click through to see in high-resolution.
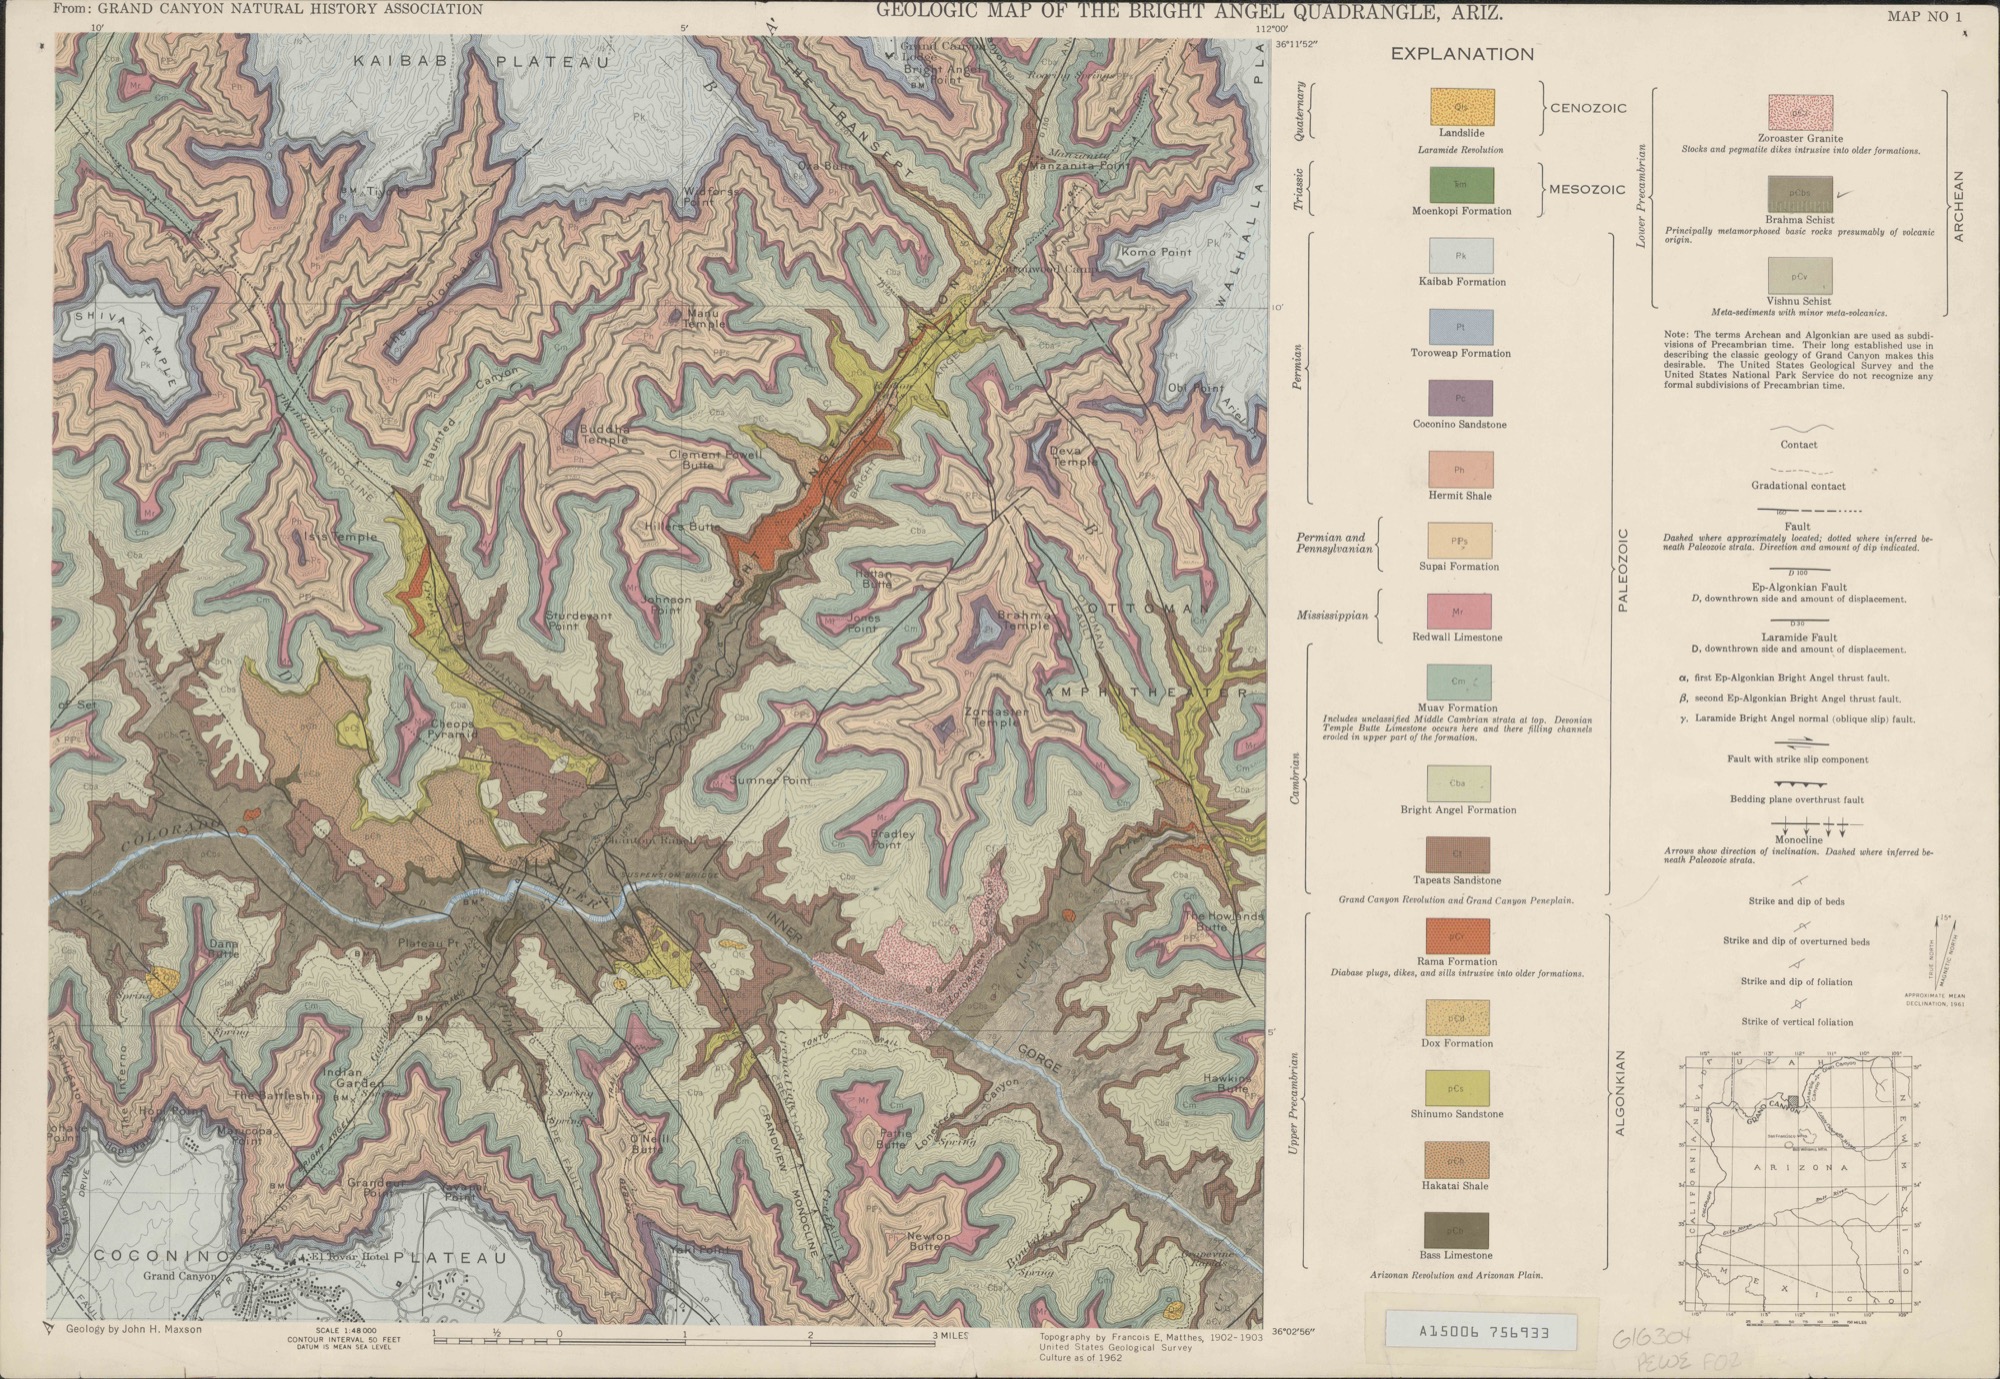
“Geologic Map of the Bright Angel Quadrangle, Ariz,” from 1962. Geology by John H. Maxson overlaid upon original topography by François Émile Matthes. This map was originally produced for the Grand Canyon Nature History Association, now the Grand Canyon Conservancy. Credit: Courtesy ASU Library Map and Geospatial Hub. Click through to see in high-resolution.
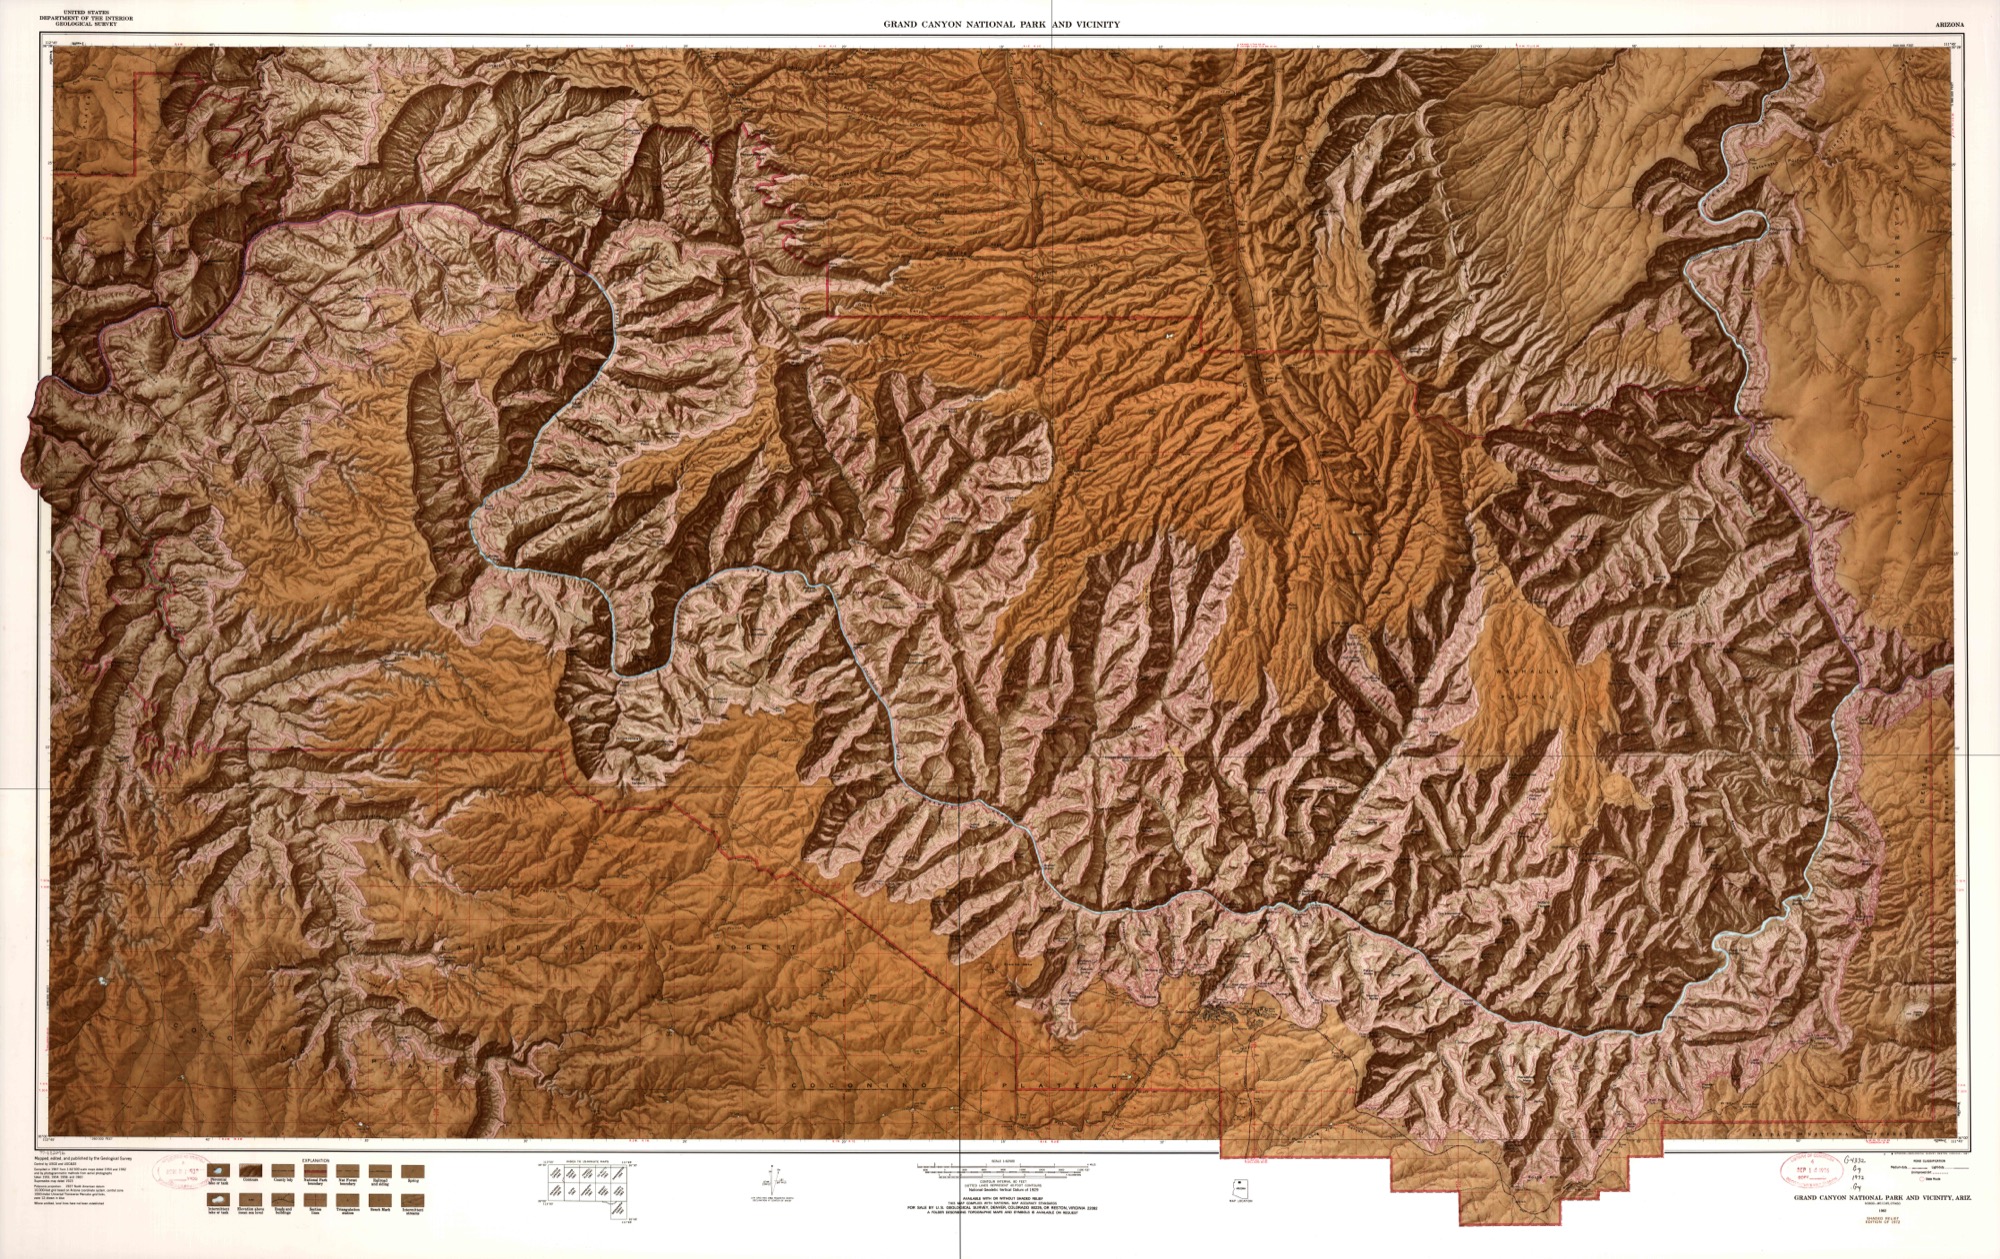
“Grand Canyon National Park and vicinity, Arizona,” by the U.S.Geological Survey in 1972. The relief of the map is shown with contours, shading, and spot heights. Credit: Library of Congress, Geography and Map Division. Click through to see in high-resolution.
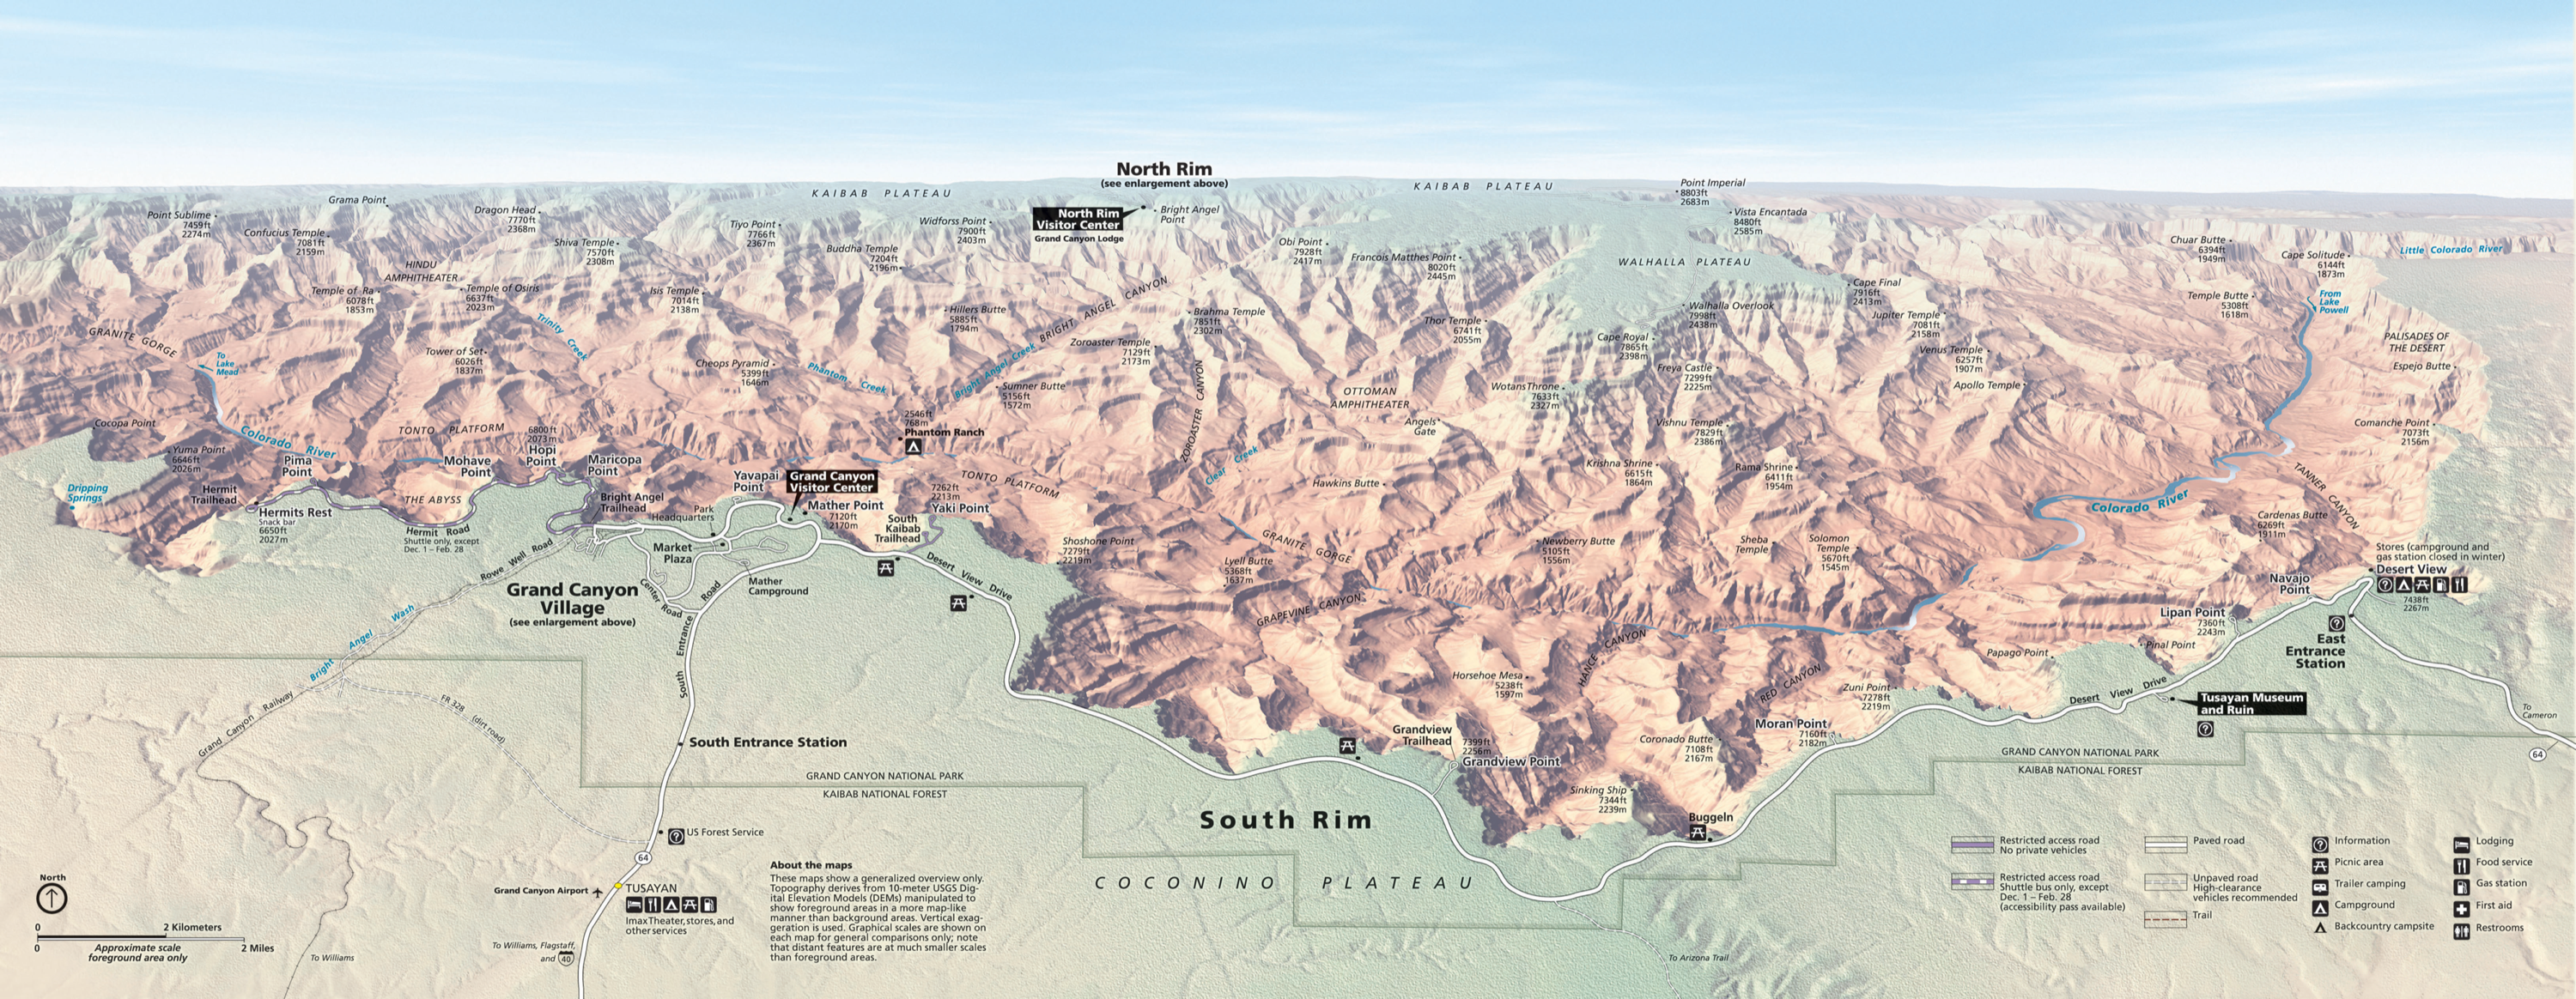
This panorama map provides the “big picture” of the Grand Canyon, with distant features shown on a smaller scale than foreground areas. “Grand Canyon South Rim Panorama Map,” by Tom Patterson for the National Park Service. Credit: courtesy the U.S. National Park Service. Click through to see in high-resolution.
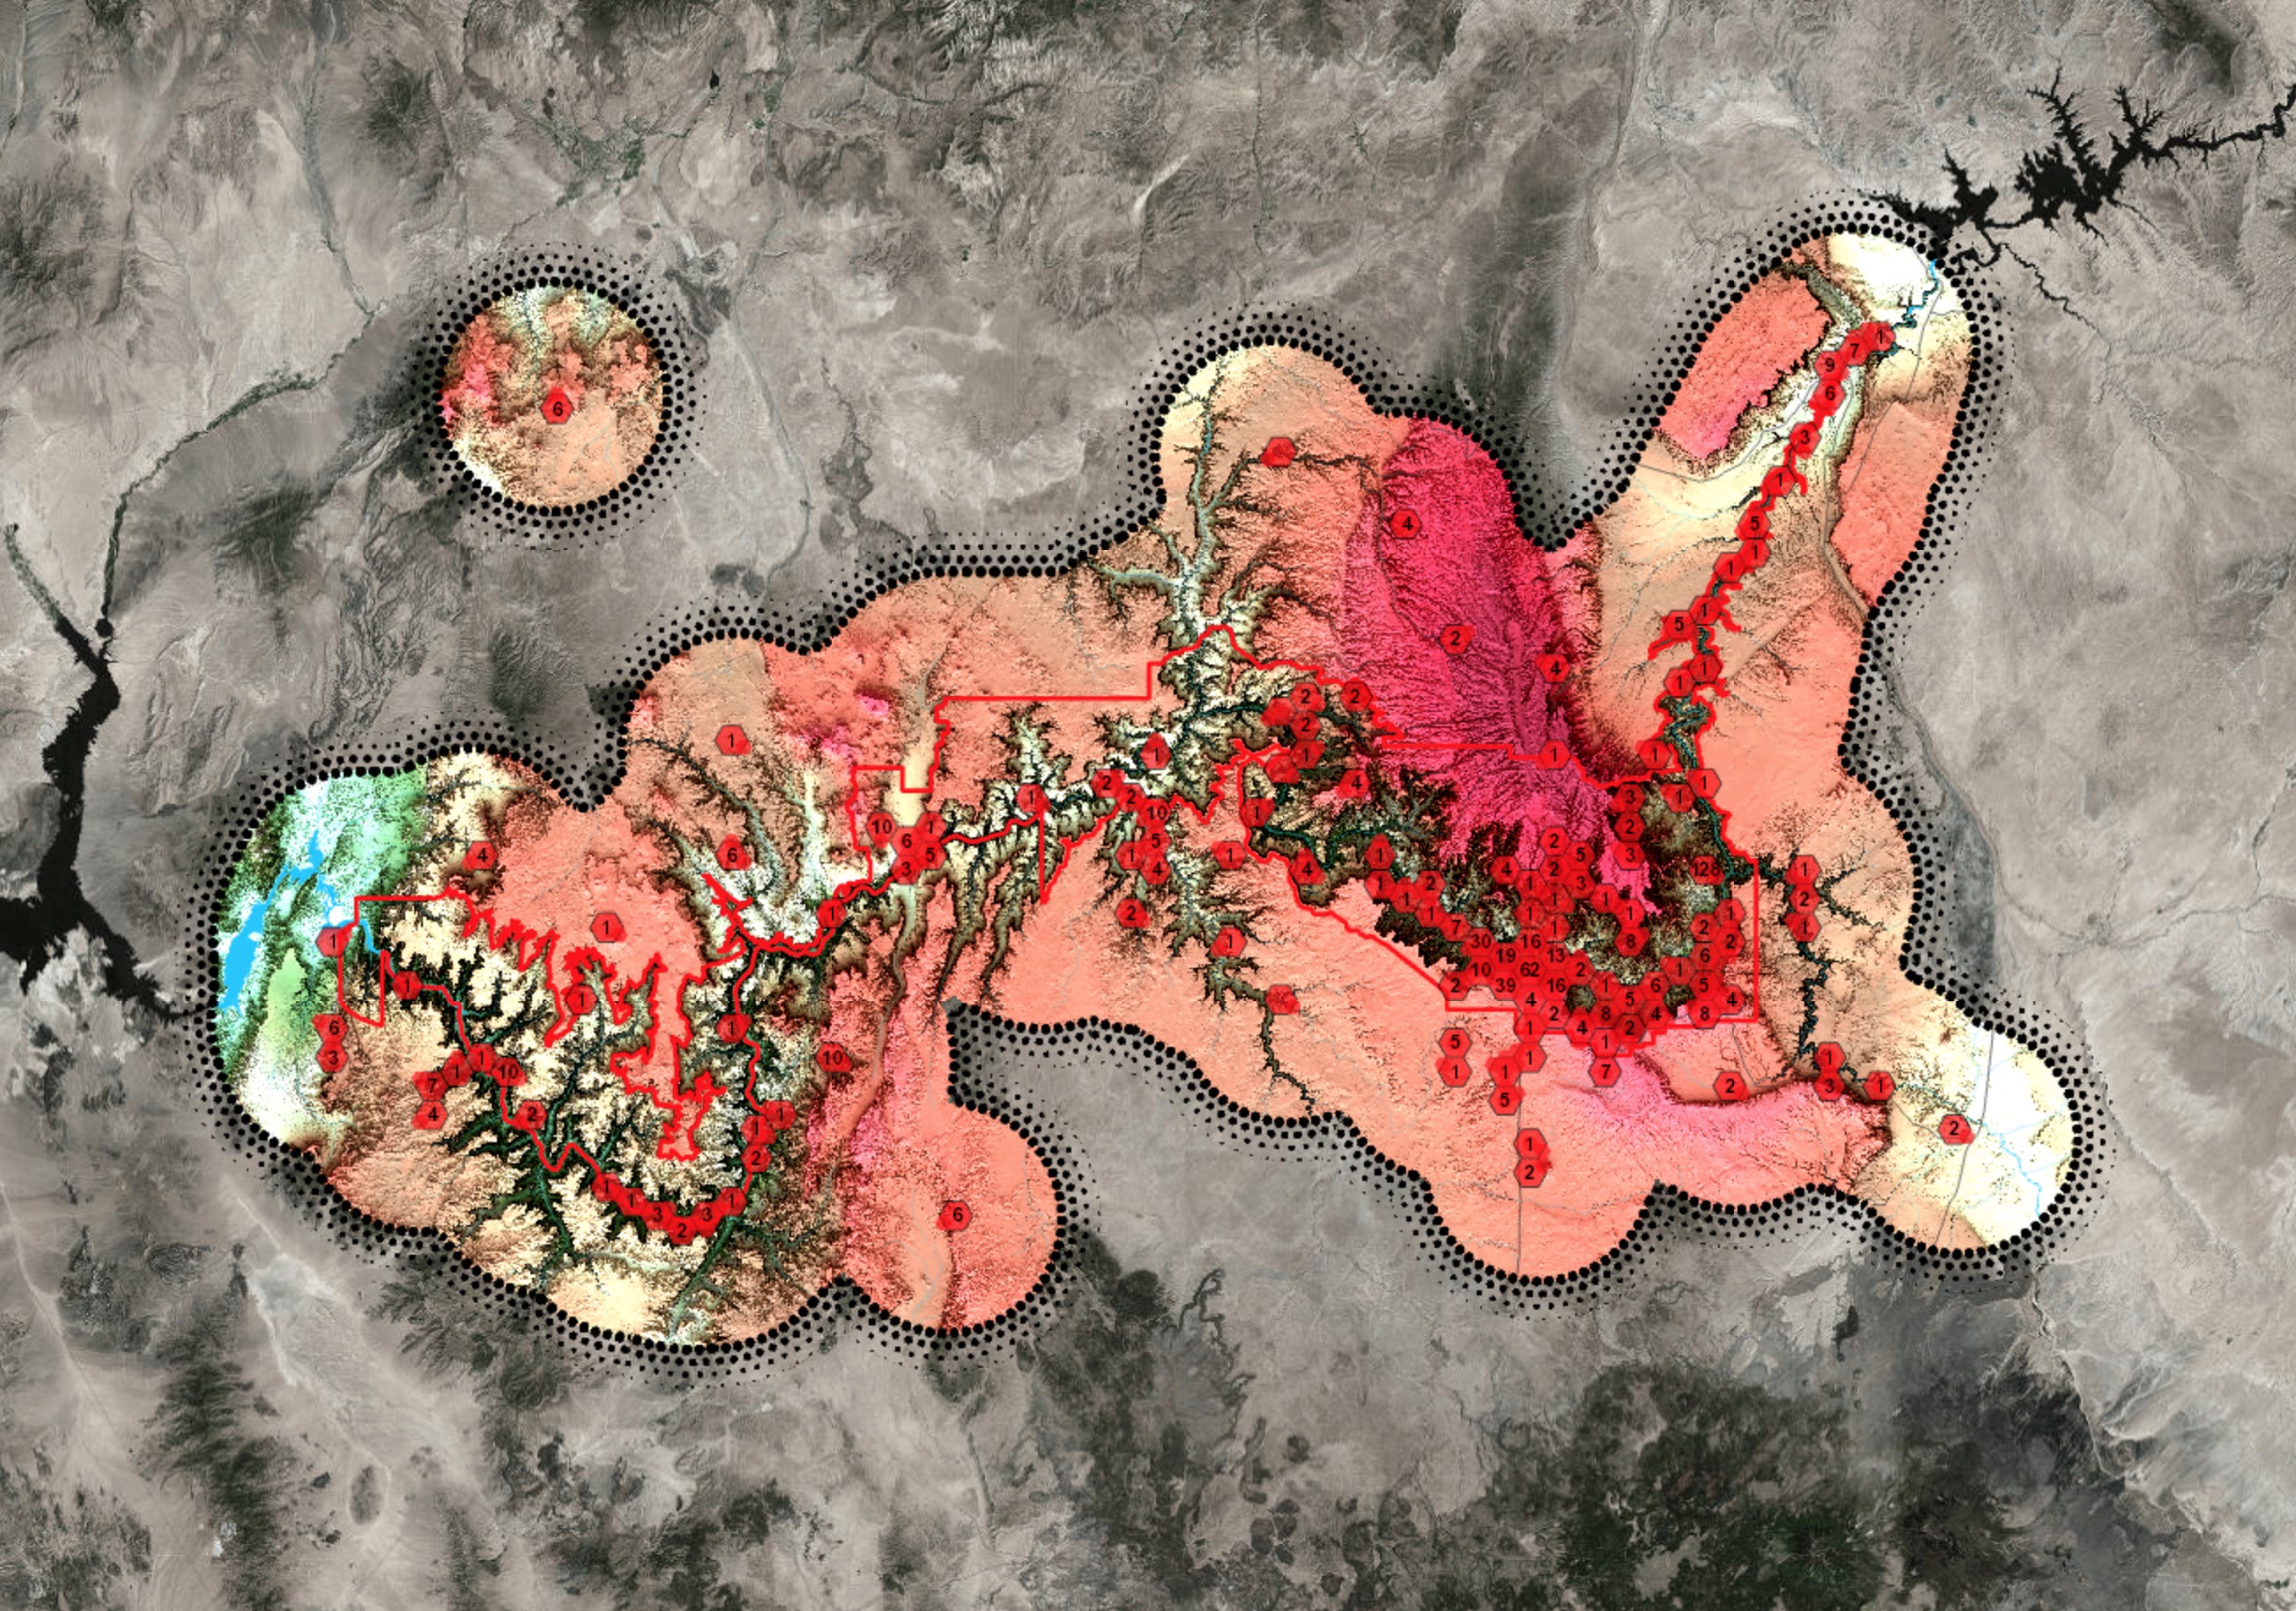
Over 770 deaths have occurred in Grand Canyon since the first river exploration by John Wesley Powell and his crew in 1869. Based on the book "Over the Edge: Death in Grand Canyon" by Michael Ghiglieri and Thomas Myers, this map shows all known recorded deaths up to 2012. Explore this interactive map to discover the trials and tribulations of how these victims perished in one of the most beautiful, yet hostile environments on Earth. Credit: Courtesy of Kenneth Field and Esri
Make your gift today. Invest in quality science journalism by making a donation to Science Friday.
Lauren J. Young was Science Friday’s digital producer. When she’s not shelving books as a library assistant, she’s adding to her impressive Pez dispenser collection.