Grade Level
9-12
minutes
15 min - 1 hr
subject
Life Science
Activity Type:
data analysis, ecology, microbiology
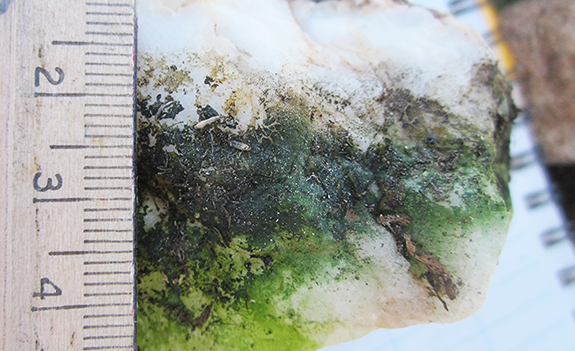
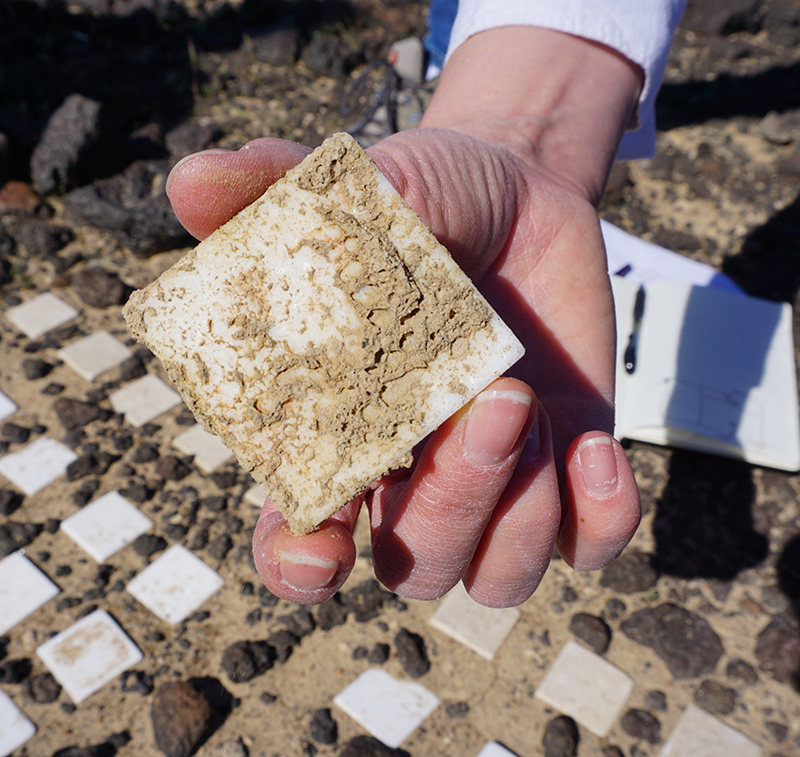
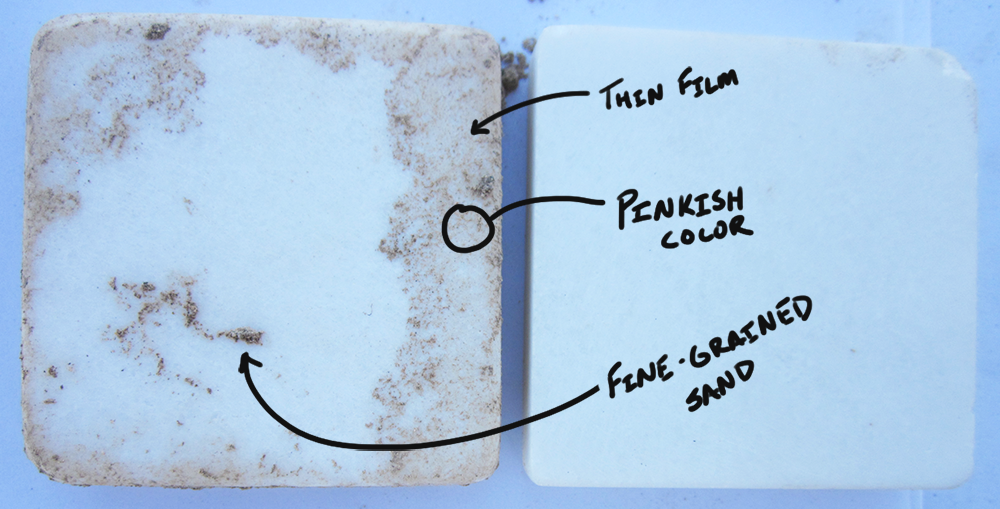
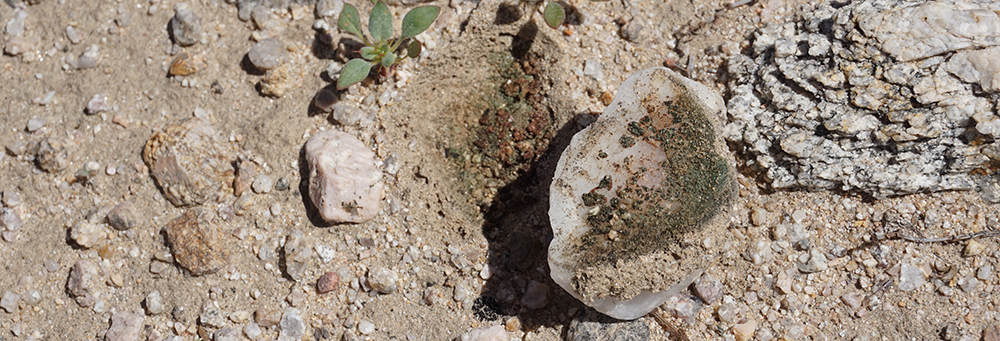
The world’s deserts are harsh environments. Some are extremely hot like the Sahara in Africa, while others are frozen deserts, like those in the polar regions. What unites them is that they are all very dry, receiving little annual precipitation. It might seem like nothing could grow in these environments. But if you turn over a white rock like quartz or marble in practically any desert on earth, you’ll see something that looks like this:
This is a colony of cyanobacteria, with plenty of dirt sticking to it.
Cyanobacteria are bacteria that are able to conduct photosynthesis, meaning that they can make the sugars and starches they need to survive from sunlight, water, and carbon dioxide. They’re an extremely old group of organisms—fossilized cyanobacteria have been recovered that are 3.5 billion years old!
Cyanobacteria can survive in a variety of conditions in nearly every ecosystem on Earth, but they have their limits. If they get too hot, too cold, or too dry, or if they’re kept in the dark, or are exposed to high levels of the sun’s ultraviolet rays (which can cause their DNA to mutate), they won’t be able to survive. By living under rocks, cyanobacteria can escape these environmental extremes.
Quartz and marble rocks create great environments for cyanobacteria. Because these rocks are semitransparent, they shield cyanobacteria growing underneath them from harmful levels of UV radiation while still allowing in sufficient light for the microbes to photosynthesize. The quartz also protects cyanobacteria from being swept away by high winds or the rare desert rainstorm.
Cyanobacteria are single-celled microorganisms, and they’re too small to see individually. But when they multiply into colonies, the colonies are large enough that they can be easily seen. For instance, colonies of aquatic cyanobacteria often appear as greenish globs or films in lakes and rivers (which is why they are often confused with algae). Meanwhile, colonies of cyanobacteria that live under rocks look more like a stringy mat of packed soil and sand. When they become well established, the rock itself becomes streaked with bright green, red, or burnt orange.
An organism or community of organisms that lives under a rock is called hypolithic, which literally means “under rock.” Some of the sugars that hypolithic cyanobacteria make during photosynthesis, called polysaccharides, are secreted and used to cement them (and some dirt) to the undersides of quartz rock and hold them in place.
A Hypolithic Cyanobacteria Experiment
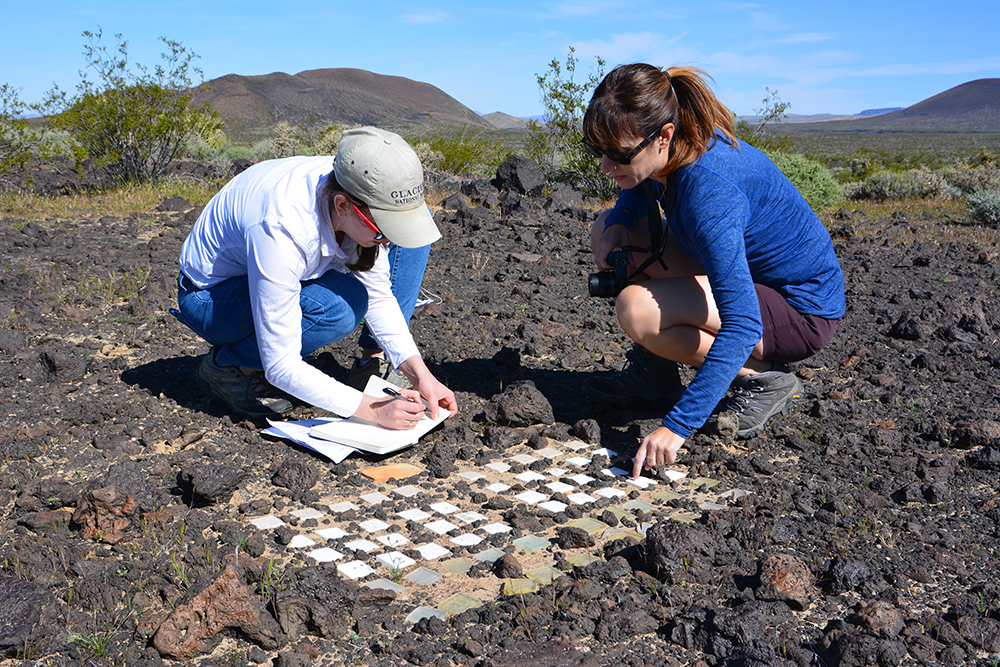
How long does it take hypolithic cyanobacteria communities to grow? And do cyanobacteria grow differently in different deserts? High school science teacher Michael R. Wing set out to answer those questions as the leader of the Worldwide Artificial Hypoliths Project.
With the help of his team, Wing, who teaches at Sir Francis Drake High School in San Anselmo, California, has placed arrays of marble tiles—square pieces of white rock that resemble quartz in their color and transparency—in deserts on every continent. The study aims to determine how quickly, and under what conditions, hypolithic cyanobacteria grow.
Wing’s team of collaborators—including teachers, students, researchers, and even some Science Friday staff—have returned or have plans to return to all of the sites where the tiles have been placed to document colony growth through time.
Now it’s your turn to examine findings from three of the sites that they have revisited.
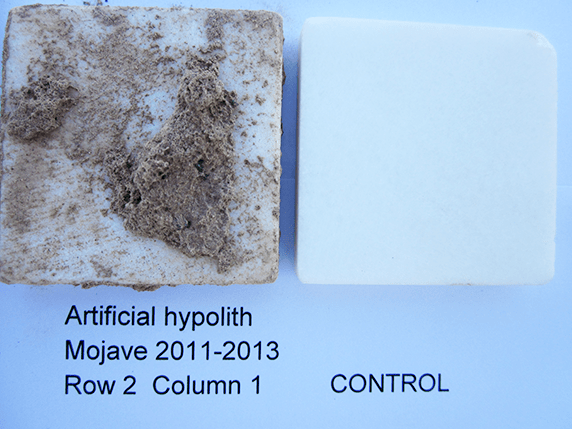
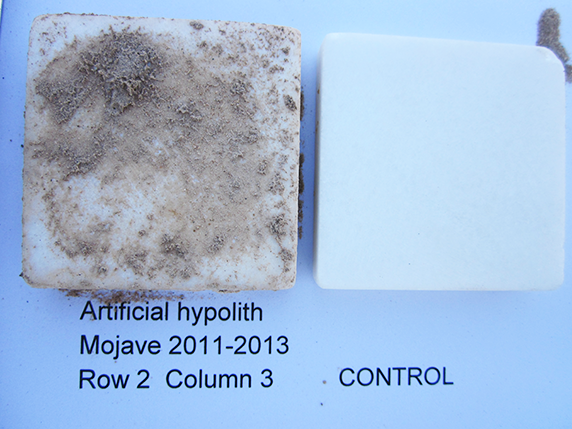
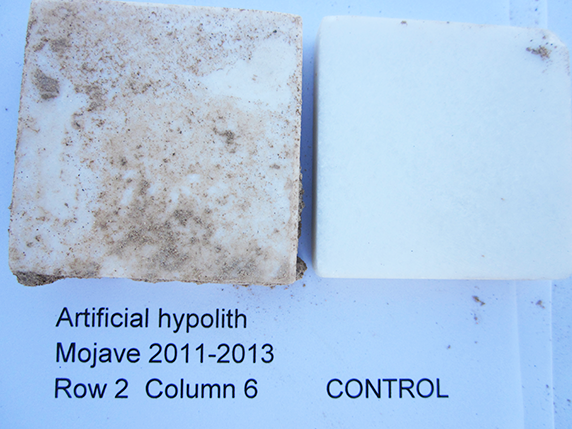
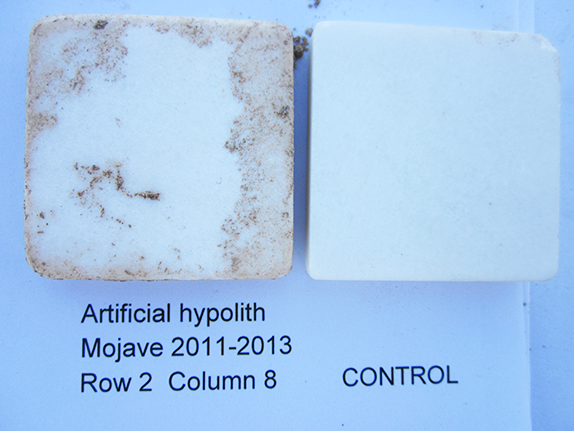
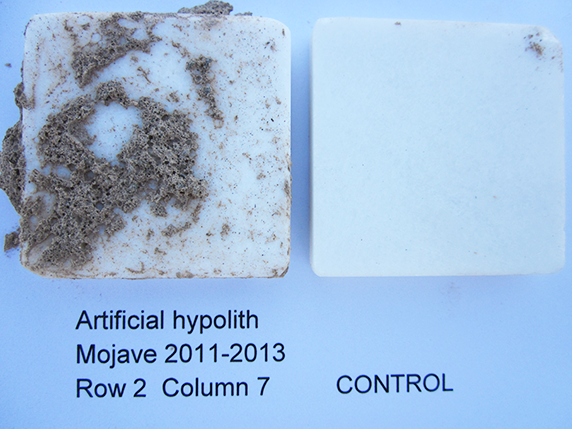
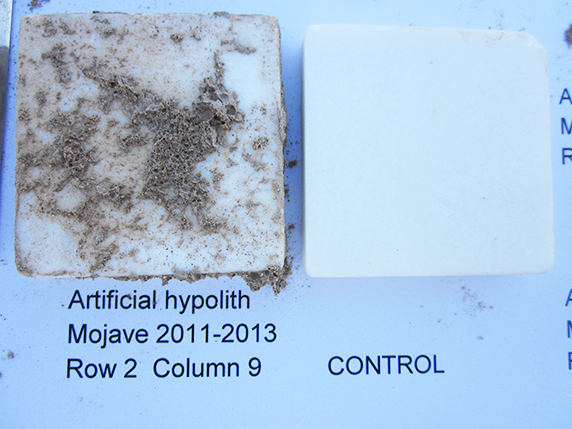
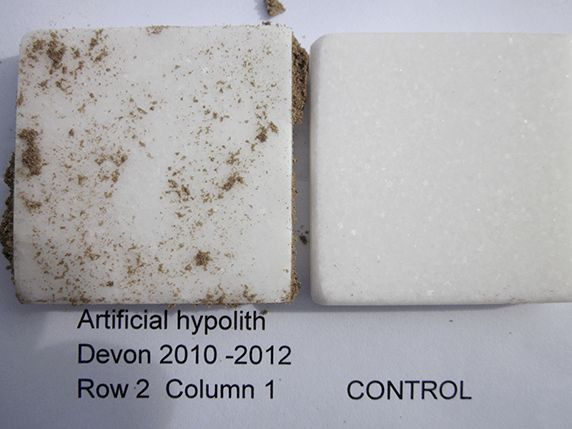
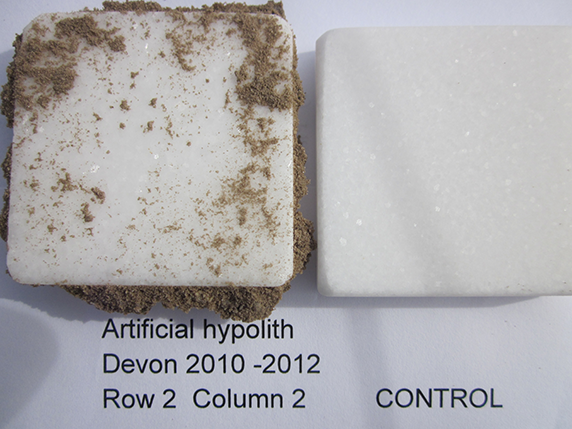
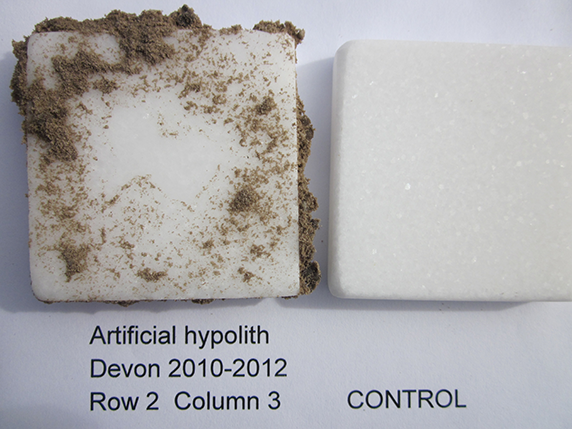
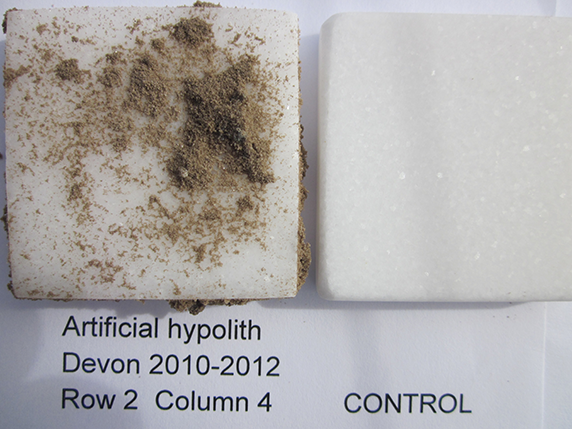
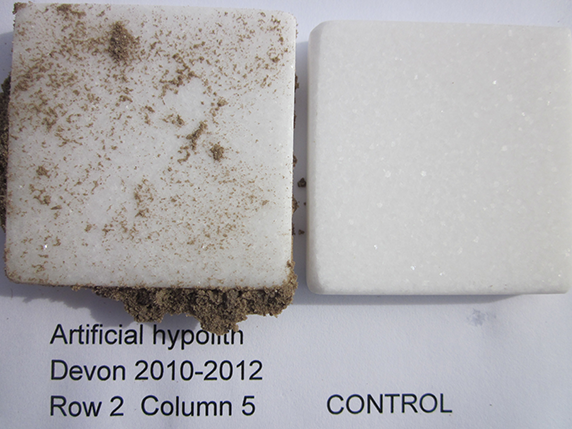
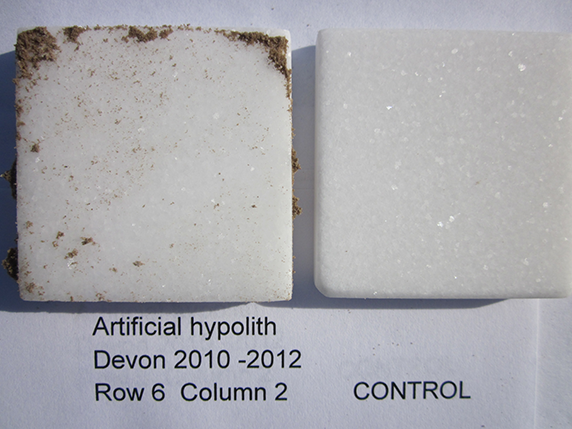
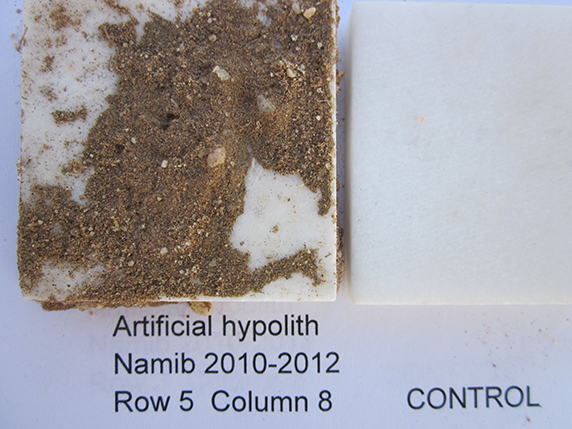
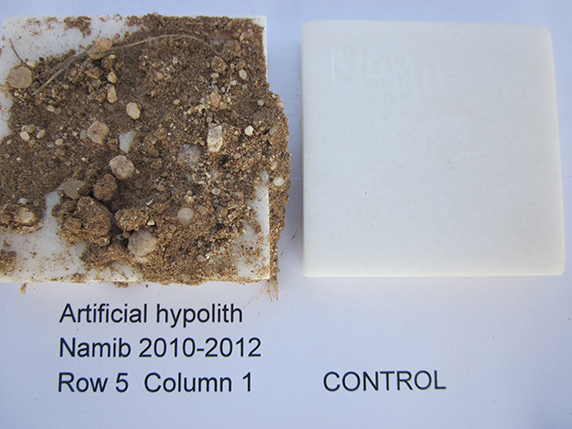
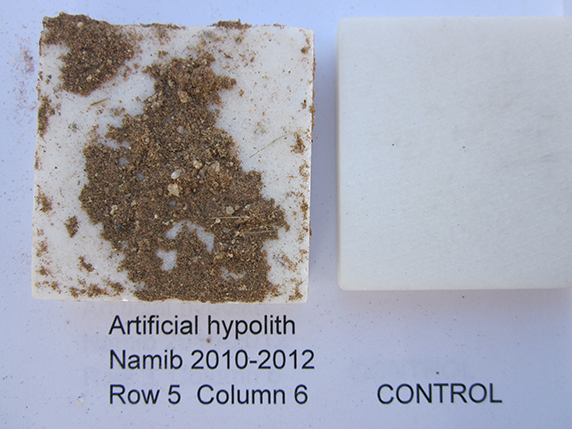
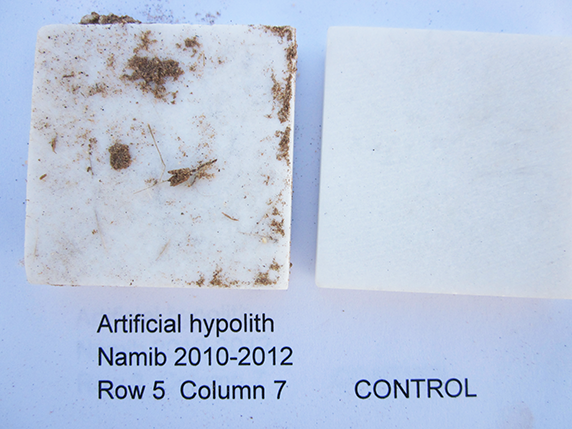
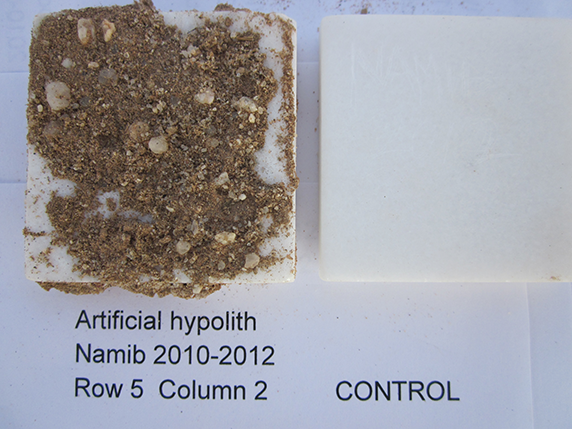
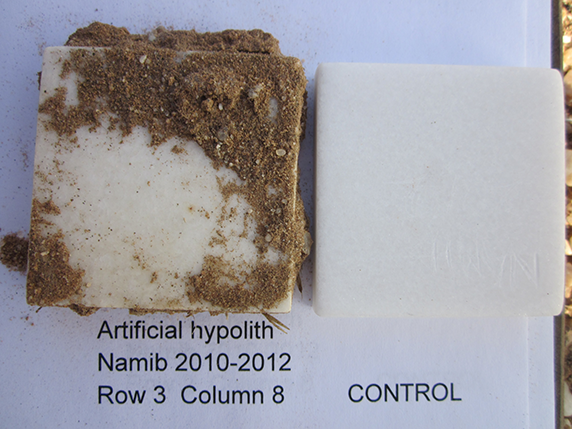
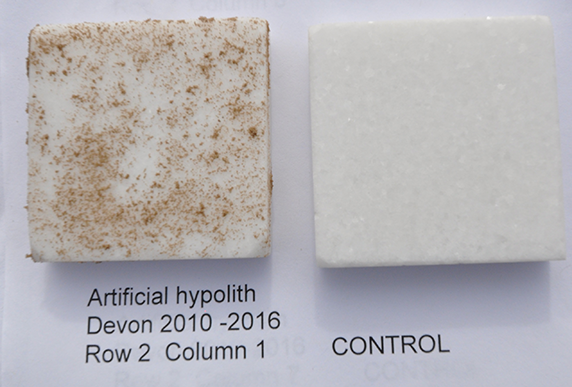
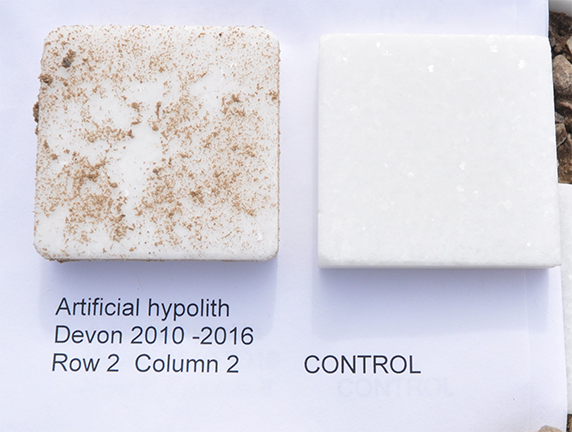
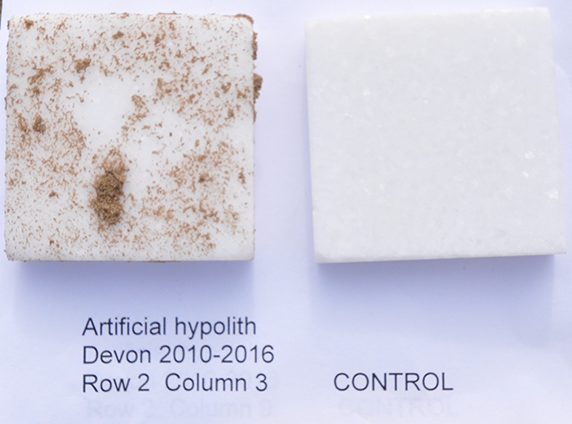
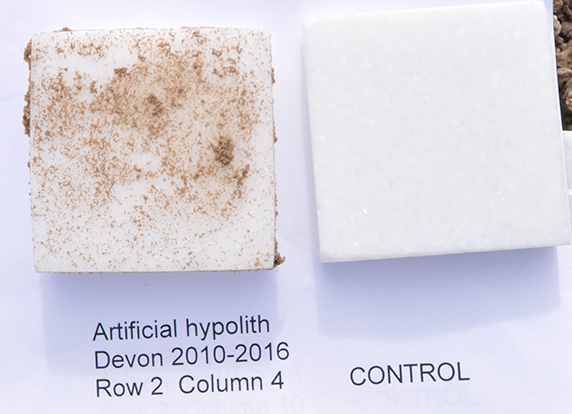
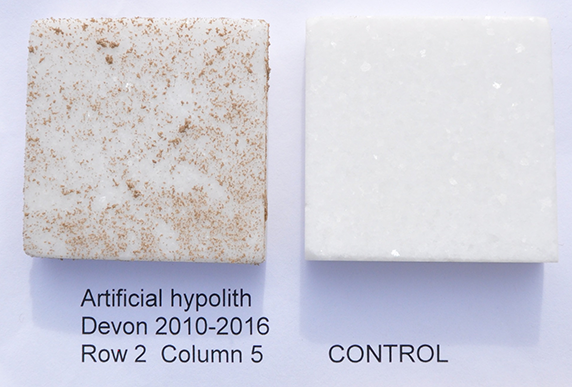
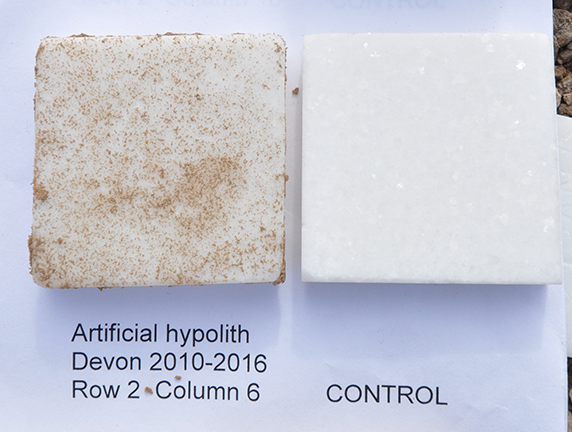
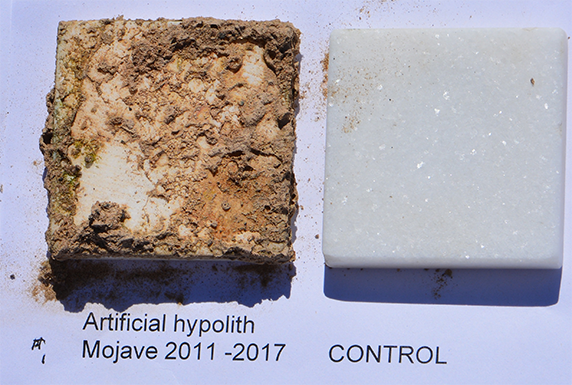
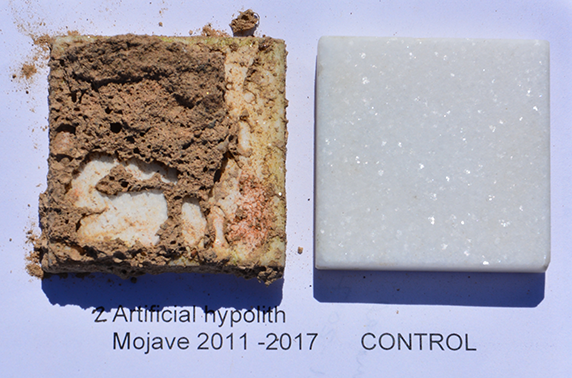
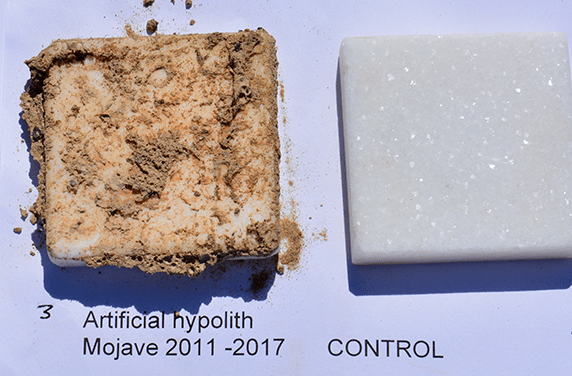
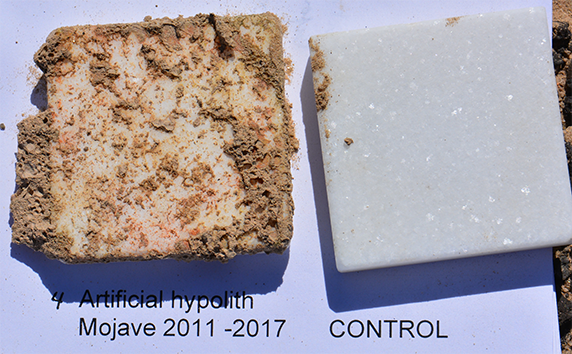
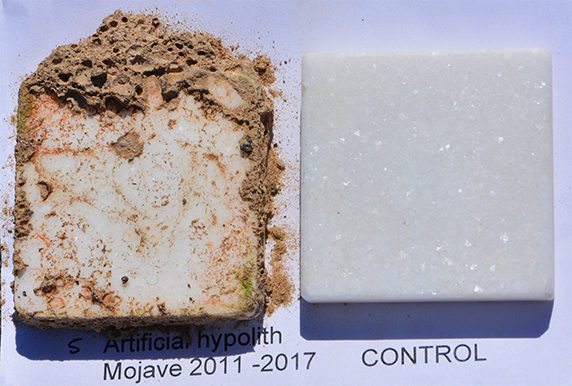
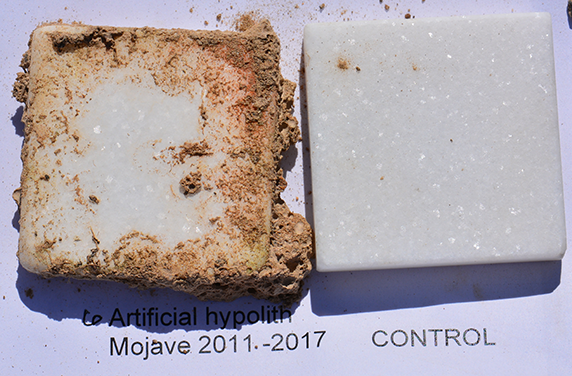
Below are images of what overturned marble tiles looked like after two years at the following three field sites: the Mojave Desert in California, Devon Island in Nunavut, Canada, and the Namib Desert in Namibia. Each tile was photographed next to a clean tile for comparison. For the Mojave Desert and Devon Island field sites, there are also images of overturned tiles after six years of growth.
At each site, record the following in a notebook or use this data sheet:
- The amount of cyanobacterial growth on each tile, scored on a scale of 0 to 5.
0 = completely clean; 1 = flecks of dirt, but mostly clear; 2 = half covered by dirt; 3 = mostly or completely covered by dirt; 4 = some green visible; 5 = mostly green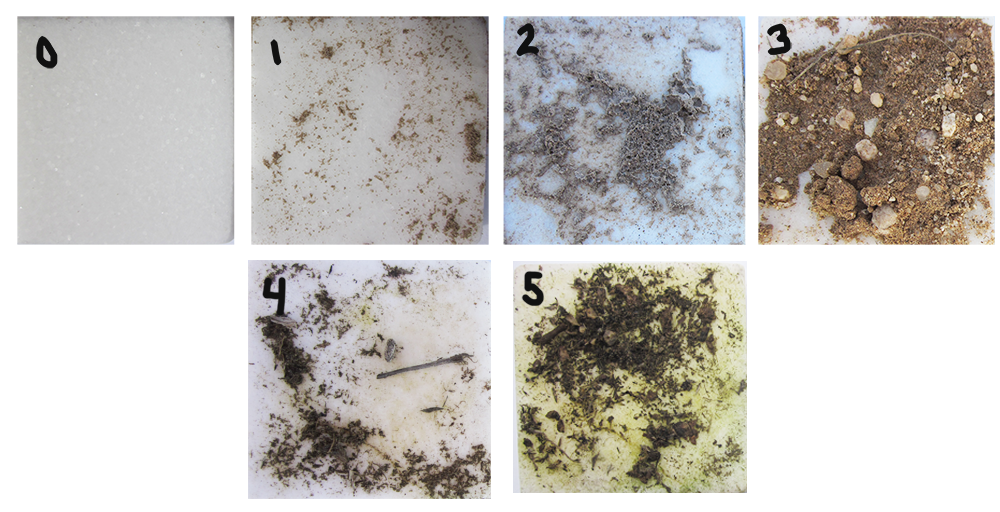
Credit: Michael Wing - Observations of the color and appearance of cyanobacterial growth on each tile. Record notes about the texture, color, material, amount of growth, and patterns in growth that you notice.
Credit: Xochitl Garcia - A short summary of the environment at each site. Use this field site information sheet to help you.
Based on the environmental data, how does this field site compare to the other two field sites? Is it hotter, colder, drier or wetter? How far is it above sea level?
Make sense of your data
Consider the overall patterns after two years:
- Based on your observations, describe how much cyanobacterial growth was typical on a tile after two years in the field.
- Were any of the tiles as white or almost as white as the clean tile? Why do you think those tiles did not change color?
- Compare the tiles from all three deserts. Which desert seemed to support the most cyanobacterial growth? Which desert seemed to support the least?
- Calculate the average score of cyanobacterial growth after two years for the Mojave Desert tiles by adding their scores together and dividing by 6, and then do the same for Devon Island and Namib-Naukluft National Park. Which desert scored the highest for growth, on average, after two years?
Compare two years of growth to six years of growth
Below are images of what overturned travertine tiles looked like after six years in the Mojave Desert in California, and Devon Island in Nunavut, Canada. Make the same observations for these tiles as you did for the Year 2 tiles, recording your observations on the appropriate portion of your datasheet.
How does cyanobacterial growth change after six years?
- Compare the tiles from the Mojave Desert after two years to the same tiles after six years. Was there a difference in the amount of cyanobacterial growth after six years compared to two? How can you tell? Refer to your data in your answer.
- Now compare the tiles from Devon Island after two years to the same tiles after six years. Was there a difference in the amount of cyanobacterial growth after six years compared to two? How can you tell? Refer to your data in your answer.
- The Worldwide Artificial Hypoliths Project team has not yet returned to Namibia to look at the tiles after six years. What would you expect those tiles to look like, based on your observations of tiles from Devon Island and the Mojave Desert?
- Calculate the average score of cyanobacterial growth after six years for the Mojave Desert tiles by adding their scores together and dividing by 6, and then do the same for Devon Island. How do these average scores compare to the average scores you calculated for these sites after two years?
- Based on the averages you calculated, is there more or less cyanobacterial growth after six years than after two years at each of these sites?
Compare tile growth to environmental variables
On your own or with the help of this environmental data graphing worksheet, try plotting the average scores of tiles from Year 2 for each of the field stations (y-axis) together on a chart against one environmental variable (x-axis), such as the temperature, annual precipitation, or elevation of each field site.
- Graph the Year 2 growth scores versus the annual precipitation at each site.
- Graph the Year 2 growth scores versus the average temperature at each site.
- Graph the Year 2 growth scores versus the elevation of each site.
- Finally, graph the Year 2 growth scores against one additional environmental variable of your choosing. Do you think the latitude of a site might have an effect on cyanobacterial growth? What about minimum temperature?
Reflect:
- Do you see any relationship between cyanobacterial growth and the environment where they are located? Do colonies of cyanobacteria seem to grow more in warmer sites? Does elevation correlate with growth? How about precipitation? Use your charts to answer.
- Besides the environmental variables you already examined, what other factors could be influencing growth? How would you go about measuring those variables? What experiments could you conduct to see if those variables influence cyanobacterial growth?
Make predictions about what will be found at three other sites:
In the last couple of years, the Worldwide Artificial Hypoliths Project has placed arrays of tiles in additional locations around the globe, but not all of them have been checked yet. This is an opportunity to make predictions about what you think the Worldwide Artificial Hypoliths Project team will find at these sites when they return!
You’ll have to track down local weather information on your own in order to make your prediction. To help, here is an information sheet about each field site, its location, and the nearest weather station. Use the environmental information you find, the information sheet about each field site, and your observations of tiles from the Mojave Desert, Devon Island, and Namib-Naukluft National Park to make predictions about the amounts of cyanobacterial growth that will occur on tiles placed in India, Norway, Australia, Chile, and Antarctica after two years and after six years.
Could cyanobacteria live on Mars?
Earth’s deserts are useful models for another harsh environment: Mars. Mars also has extremely hot and cold surface temperatures, winds, and high levels of UV radiation that scour its sandy, rocky surface. For scientists looking for life on the Red Planet, and even for entrepreneurs with plans to one day colonize Mars, the cyanobacteria in Earth’s deserts provide hints about where and how microbial life might be able to persist in Martian deserts.
All data courtesy of Michael Wing
Image animations and text by Ariel Zych
Educator's Toolbox
Meet the Writers
About Ariel Zych
@arieloquentAriel Zych was Science Friday’s director of audience. She is a former teacher and scientist who spends her free time making food, watching arthropods, and being outside.
About Michael R. Wing
Michael Wing teaches science at Sir Francis Drake High School in San Anselmo, California. He is the author a dozen scientific papers and of the book Passion Projects for Smart People (Quill Driver Books, 2017). He has done field work on five continents.