Grade Level
3 - 5
minutes
15 min - 1 hr
subject
Mathematics
Activity Type:
sampling, population, sample, sample size, estimation, estimate
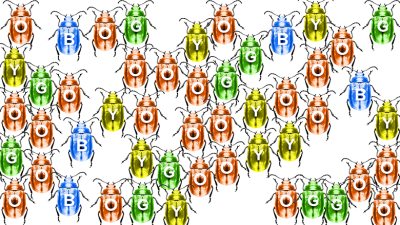
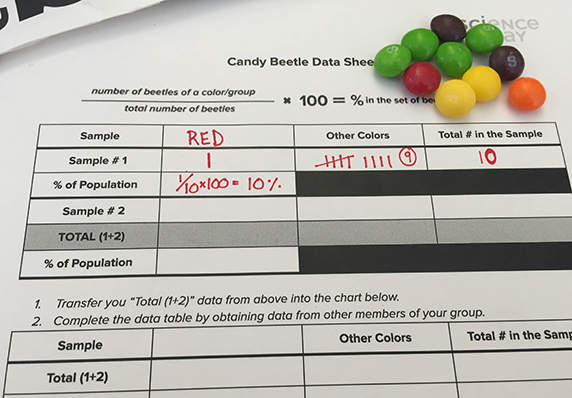
Let’s imagine that we are studying a species of beetle. The beetles come in many different colors, and we want to know how common the orange (O) coloring is in this population.
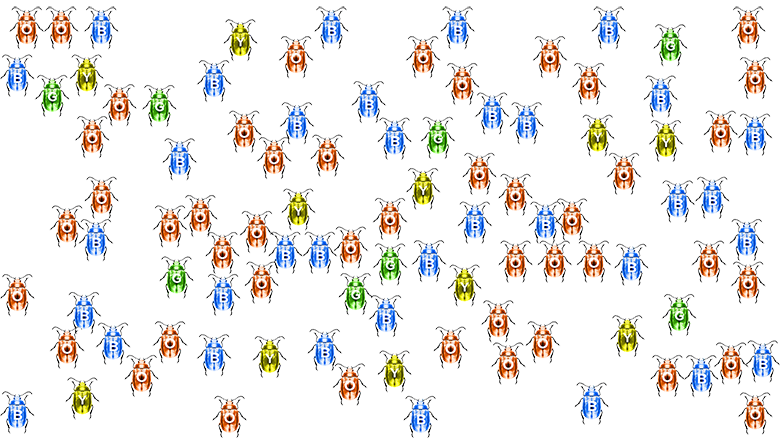
At first glance, which color beetle looks most common?
How could we determine what proportion of the population is orange, or blue?
This population of beetles can be counted by hand, but imagine a population of beetles that is 10 times larger, and moving! Scientists routinely study large groups of organisms and other subjects that would be either too time-consuming or impossible to observe or count in totality. How do scientists tackle this issue? They use a technique called sampling. Sampling is when you observe a part of something to determine a characteristic or feature of the whole. It is a method used by many different types of scientists to study a variety of things, including organisms like birds and fish, as well as natural objects like rocks and even stars!
Let’s apply the idea of sampling to the population of beetles above! The sample below is just a small portion of the original population:
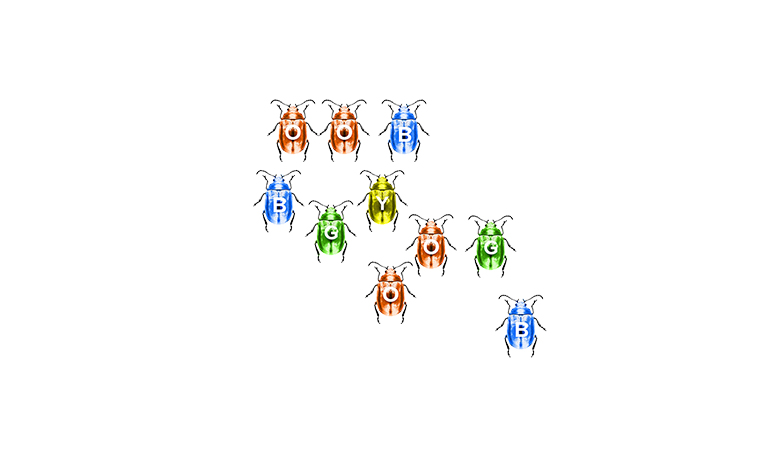
Based on this sample, what color(s) would you expect to be the MOST common in the larger population?
To illustrate why sampling works, look at the two populations below.
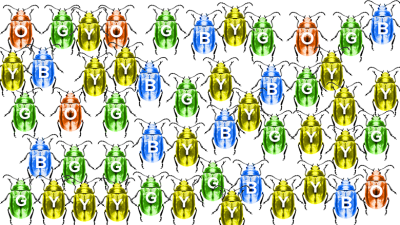
If you were to close your eyes and take a handful of beetles from population A, and then a handful of beetles from population B, in which handful would you expect to find more orange beetles? Why?
Just by looking at these two beetle populations, you can probably tell that population A has far fewer orange beetles than population B, even though the two populations are the same size. If you were to take a handful of beetles (a sample) from population A, you would therefore expect to get very few orange beetles compared to a handful grabbed from population B. Even though a handful of beetles from population A or B is just a sample of each population, it still allows you to predict which population contains more orange beetles.
How do you think taking more samples or larger samples would change the accuracy of your prediction about which color is the most common in a given beetle population? Let’s use samples from a new population of beetles to figure it out!
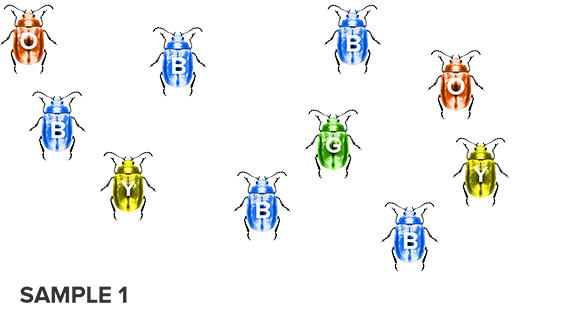
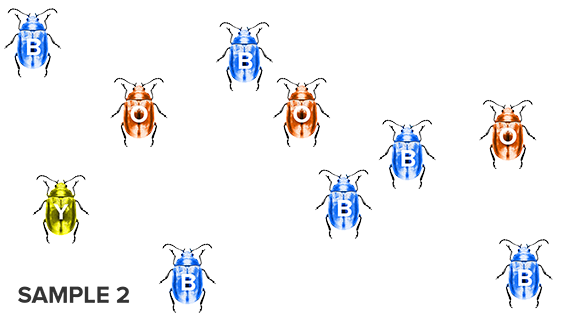
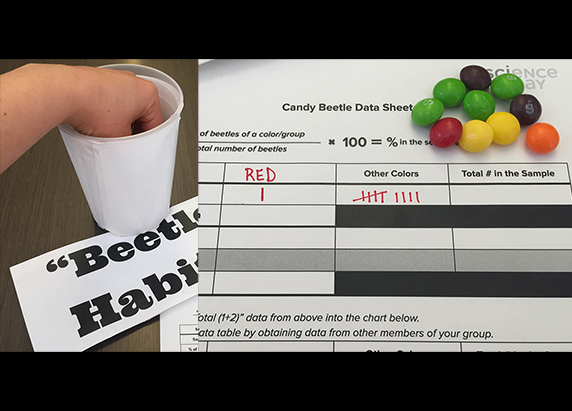
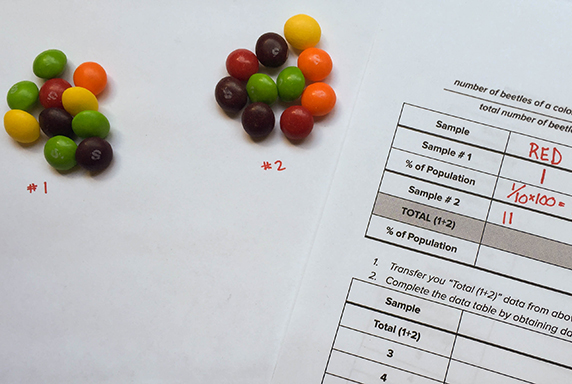
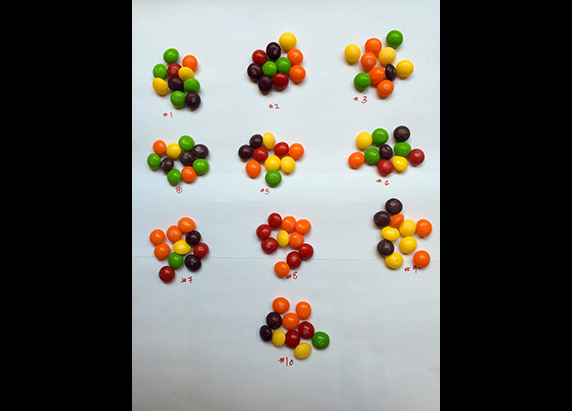
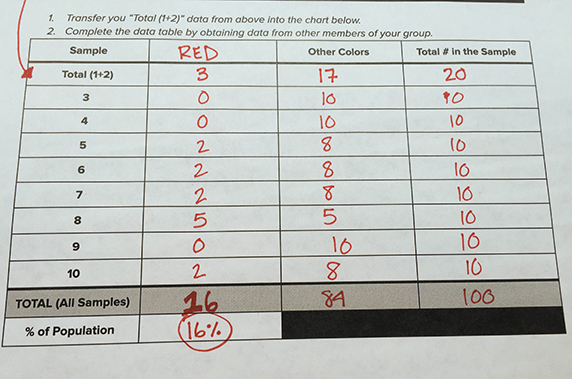
Each of the images in the slideshow below is a random sample taken from a single population of beetles. Follow the instructions on your Beetle Sample Data Sheet to count the number of beetles of each color in a sample, and then use that tally to calculate the percentage of each color in the sample. You will do this for progressively larger samples.
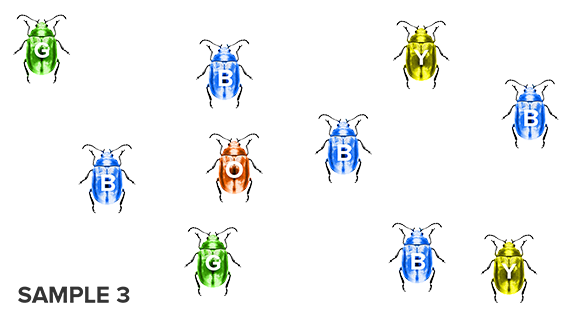
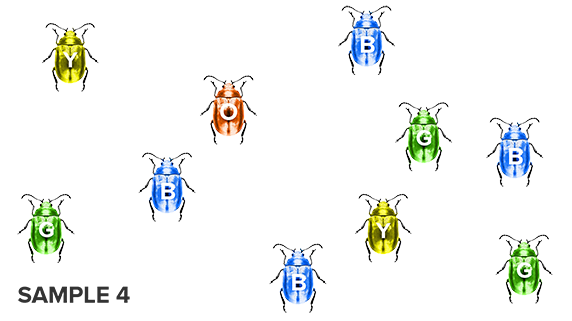
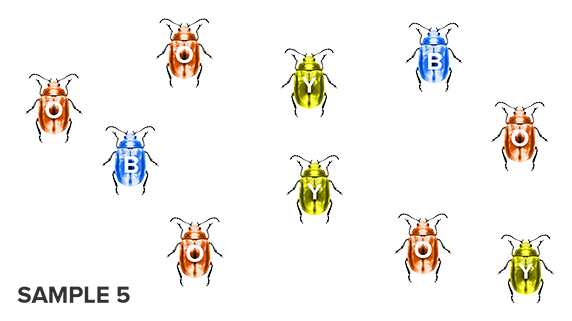
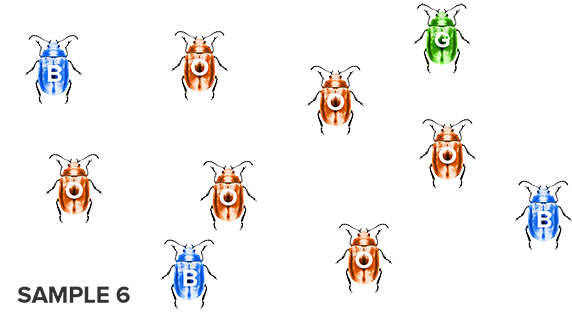

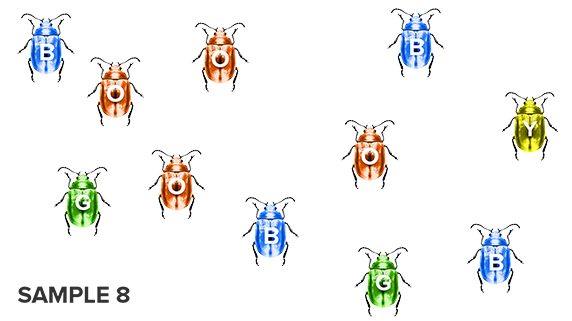
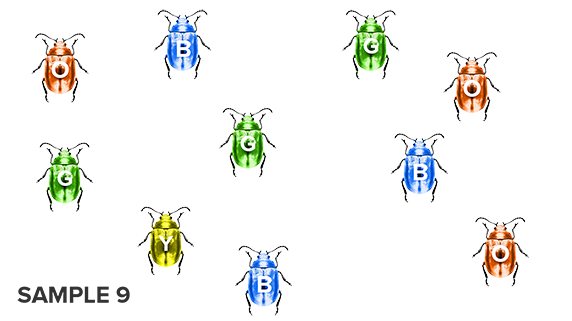
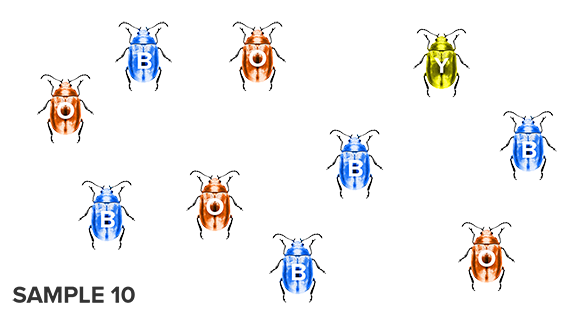
To compare your sampling data to the actual population totals, go to the final slide in the Beetle Sample (PDF).
Based on the samples you observed, what percent of the overall beetle population do you estimate is each beetle color? Based on the samples you observed, which beetle color do you think is the most common in the overall population?
Look at your data and discuss how your predictions changed with each sample you collected. Were the percentages of each color consistent as you increased your sample size, or did the percentages change? How did the accuracy of your finding change with each additional sample you collected? (See the last slide in the presentation for the actual color distribution.)
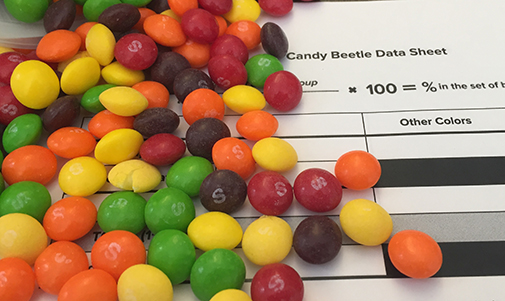
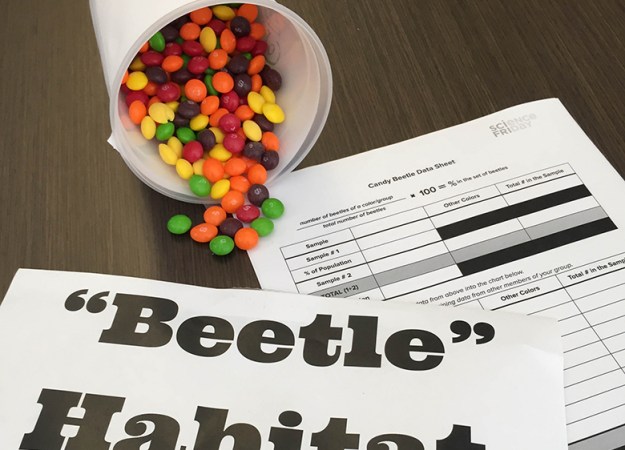
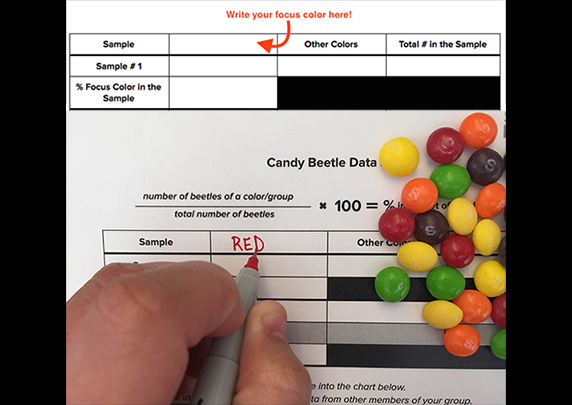
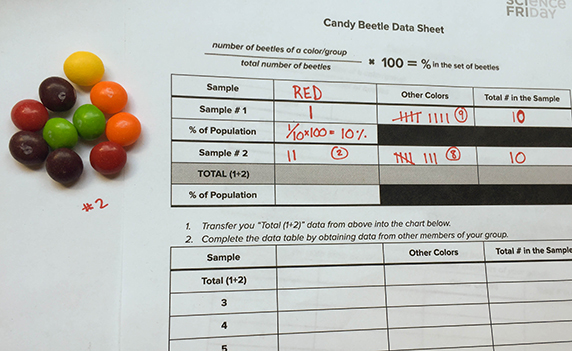
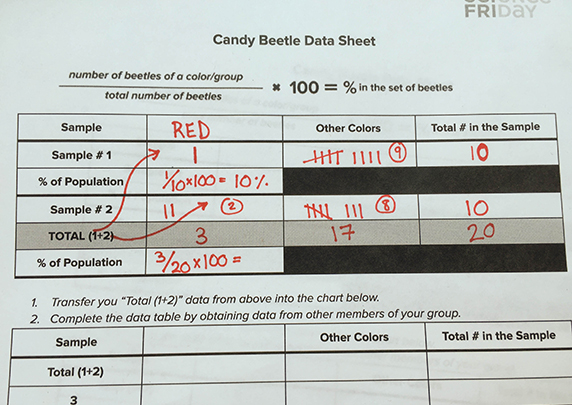
Now let’s use sampling to estimate how common a particular color is in a different type of “beetle.” You will do this sampling activity by hand.
Activity Materials (per group of 5 students)
- Large bag, 14oz or more, of colored candy (i.e. jelly beans or Skittles) or colored beads
- Calculator
- Candy Beetle Data Sheet

Discussion Questions
- Compare your first estimate of the percentage of each color beetle with the first estimates made by different classmates. Are they all about the same or all completely different?
- Which do you think was more accurate, your first estimate based on one sample, or your final estimate based on a much larger sample? How could you make your sample even more accurate?
- We can easily buy a bag of our favorite colored candy and figure out how many red candies are inside, but what if we wanted to estimate how many red candies are in all the bags at the store? Explain how to figure it out without buying and counting every bag.
- If we went out to the park, could we count all blades of grass? Why or why not? How would you propose we go about figuring out how many blades of grass there are in the entire park?
- Let’s say someone who’s sampling beetles from a jar really likes green beetles and tends to pick them up more often than, say, red ones. How would their preference bias their sample? How would their preference affect their estimates of the percentage each color makes up of the whole population?
- CHALLENGE: Create one jar with a population of jelly beans that would consistently favor one color when sampled, and one jar where all colors of jelly beans would equally turn up in samples.
Repeat the sampling protocol from above for each jar. Compare results from the two populations. How did changing the percent of each color jelly bean in the jar affect the percent of each color in the sample?
Educator's Toolbox
Meet the Writer
About Xochitl Garcia
@msxgarciaXochitl Garcia was Science Friday’s K-12 education program manager. She is a former teacher who spends her time cooking, playing board games, and designing science investigations from odds and ends she’s stockpiled in the office (and in various drawers at home).