Grade Level
6-12
minutes
15 min - 1 hr
subject
Life Science
Activity Type:
graphing data, data analysis, marine ecology
See all that data in the chart above? How do you think the data were collected? By a scientist from a ship? From a satellite? Actually, these data were collected by four northern elephant seals (Mirounga angustirostris) acting like research assistants, as they swam around the North Pacific Ocean!
Try clicking individual rows of data points in the table above. As you select the data, what do you notice about the points highlighted on the graph? What if you select a section on the graph? Do you see any patterns?
By looking at data collected by seals as they explore the ocean, we can learn a lot about both seals and their environment at the same time.
In this activity, you will look for patterns in ocean temperature and movements of northern elephant seals from the North Pacific Ocean. Classes should be divided into partner groups, and each group will work with one computer/tablet. Engaging with the data will allow you to better understand what kinds of information scientists can learn about the ocean from marine mammals and typical patterns of movement for northern elephant seals.
Learn more about northern elephant seals
How do these animals collect data for scientists?
Scientists and engineers have developed a range of sensors for collecting data about the ocean and animal behavior. These sensors can be engineered to fit together in an instrument about the size of a credit card. By attaching these small bundles of sensors to marine mammals, scientists can gather a large amount of data from many places and depths in the ocean.
- How far and wide are these northern elephant seals swimming around in the North Pacific Ocean?
- Where were the data collected?
Below you’ll find the tracking data from northern elephant seals #546, 541, 536, and 528. Explore the data and the map to learn more about the ocean and how seals are exploring it.
Map Tips:
- To see which points belong to which elephant seal’s track, make sure the animal_id is listed at the bottom of the map. If it is not, drag the animal_id column heading to the center of the map.
- Choose another column from the right side of the table (e.g., speed, depth, or temperature) and drag it onto the center of the map. What happens?
Seal data collection—Q & A
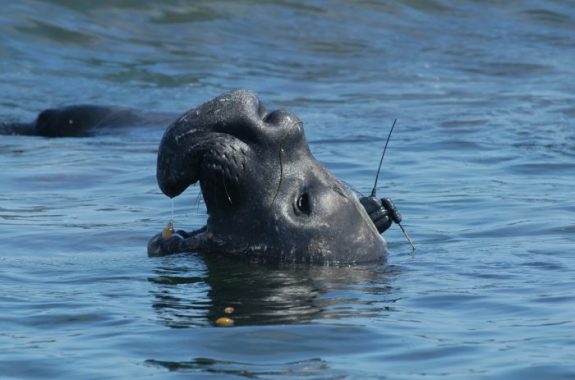
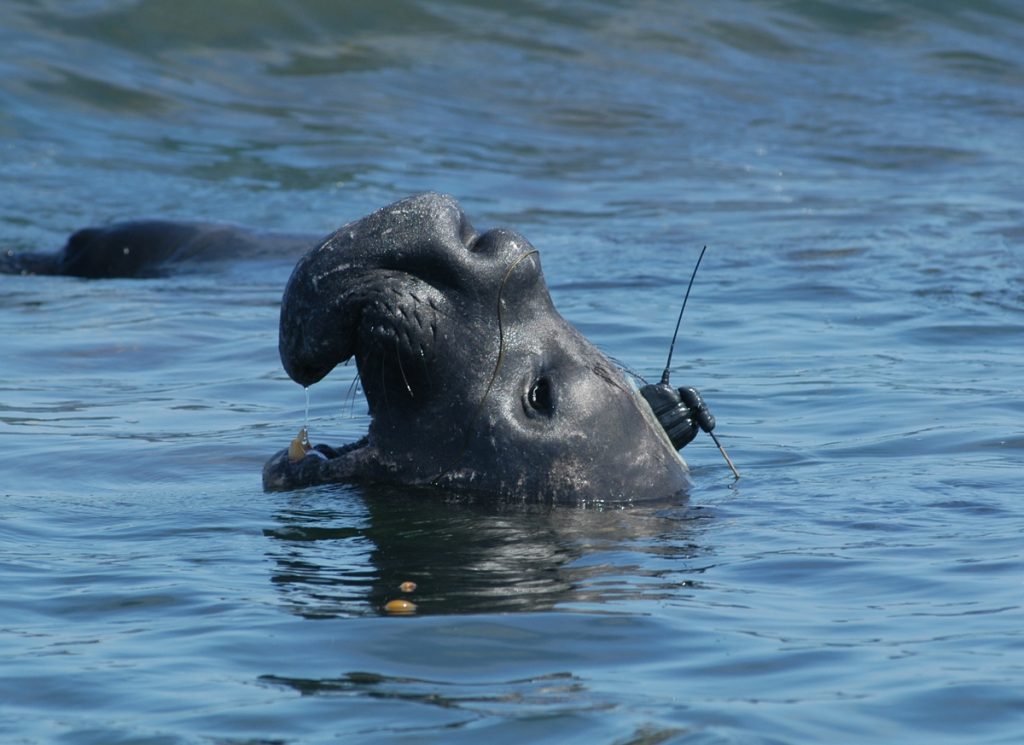
Why do scientists attach the instruments to seals’ heads?
Each instrument has a small device, like a phone, that allows it to talk to satellites up in the sky and send the data to scientists. When northern elephant seals come to the surface for air (remember they are mammals so they need to breathe air to survive) they typically just lift a small amount of their head out of the water. Scientists have to attach the devices to the heads of seals so that the devices can make contact with satellites above water.
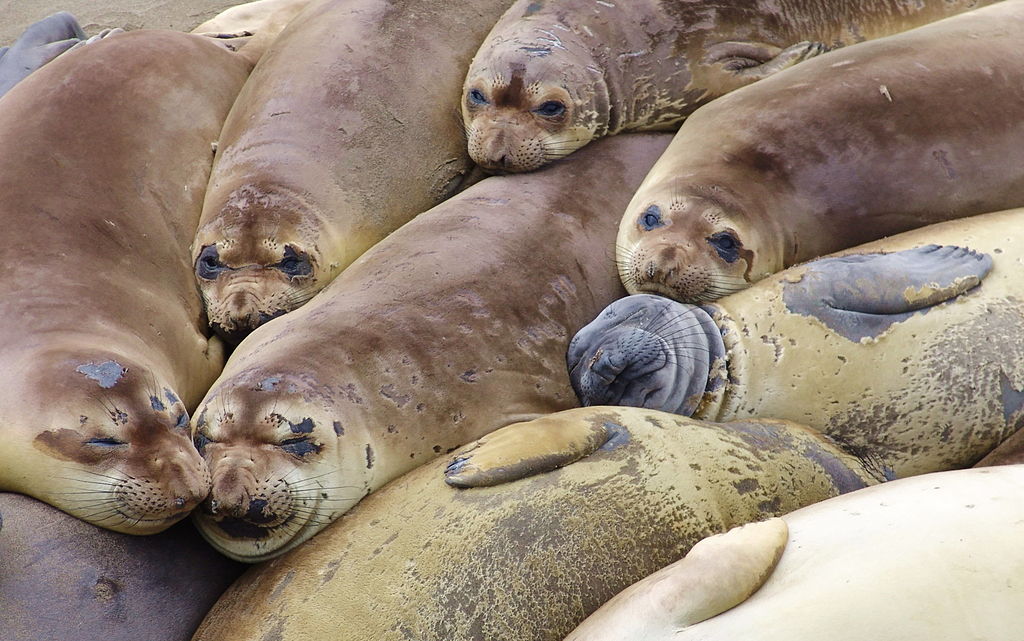
But don’t the instruments hurt the animals?
No. Northern elephant seals molt, or loose, their fur every year. Scientists can attach the instrument to the top of the seals’ head, and it will fall off the next year when the animal sheds its fur.
What can we learn from seals?
Data collected by northern elephant seals can tell us many things! For example:
- We can start to see patterns in changes in the ocean over a large amount of space and deep down into the water.
- We can look at how long seals stay underwater, how far they travel, how deep they dive, and how often they dive.
- We can look for patterns in the behaviors of seals and compare them to environmental conditions such as water temperature to better understand how the environment influences seal behavior.
- We can start to compare the movements of individual seals to one another and look for patterns.
What is it like for northern elephant seals out in the ocean?
Your objective:
Explore different data variables collected from the instruments on four northern elephant seals in the northern Pacific Ocean in 2005-06. What can you observe about individuals and the group overall?
Data Tips:
- Select other variables from the table to explore the data in ways that interest you.
- Zoom in and out of the map to look at different scales of space that interest you.
- For more tips and a guide on how to use the data interactives, click here.
- If you cannot see all of the data on the graph, select the rescale button in the top right (square with four arrows) to re-center the data on the graph.
Interpretation & Analysis Questions:
- What did you find interesting about what you observed in the northern elephant seal data?
- Did you observe any patterns? If so, what were the patterns and for which variables?
– How deep do the northern elephant seals go in the water? Is it the same for all four of the seals?
– At what depths, do many spend their time? Why do you think that is?
– What was the water temperature like that the northern elephant seals experienced?
– Did the water temperature vary over different depths and for different seals? If so, how? - What questions do you still have about what it is like for northern elephant seals out in the ocean? What kind of data would you need to answer those questions?
Learn more about tagging!
- Read about another group of seal-tagging fiends: Chris Benjamin’s Dec 4, 2014 story “Seals Deep Dive for Ocean Data”
Go on an adventure with Mike Fedak as he explores how seals sporting telemetry tags are providing scientists with data on the ocean environment around Antarctica.
NOTE – This story is about fieldwork with elephant seals at Edwards Island, Antarctica. However, the data in the above activity are from northern elephant seals in the North Pacific Ocean.
- Dive into more data with TOPP (Tagging of Pelagic Predators)
TOPP is an international, multidisciplinary collaboration among biologists, engineers, computer scientists and educators, to view and interact with animal tracking data, as well as oceanographic datasets, to understand more about life as a marine pelagic predator.
- Explore the data further with Ocean Tracks
Use some of or all the five learning modules that Ocean Tracks developed for high school classrooms in 2013 to explore marine mammal track data.
- You can download the full northern elephant seal dataset from this activity here.
This is a .csv file with a header row. You can open it in Excel, Numbers, Google Sheets or any other spreadsheet program.
Resource objectives and standards
Data literacy learning objective:
- There is natural variation in all data and looking at the variation, rather than just a single data point, provides a richer understanding of the topic.
Content student learning objectives:
- Discover how in the ocean, marine mammals have similar, but not exactly the same, behavioral patterns.
- See how scientists use data collected from marine mammals to learn about the animals and the ocean around them at the same time.
Standards:
Next Generation Science Standards:
SEP #4 Analyzing & Interpreting Data
SEP #5 Using Mathematics & Computational Thinking
SEP #8 Obtaining, Evaluating, and Communication Information
Common Core State Standards:
ELA
Key Ideas and Details: CCSS.RST.1, CCSS.RST.2
Integration of Knowledge & Ideas: CCSS.RST.7
MATH:
CCSS.MP5 Use appropriate tools strategically
CCSS.MP7 Look for and make use of structure.
Credits
![]() Dataspire: inspiring data + science literacy is an initiative of Rutgers Cooperative Extension. We envision a world in which everyone is empowered to engage with data and science in their lives. We facilitate a range of professional development trainings and develop data resources to work towards a more data and science literate society.
Dataspire: inspiring data + science literacy is an initiative of Rutgers Cooperative Extension. We envision a world in which everyone is empowered to engage with data and science in their lives. We facilitate a range of professional development trainings and develop data resources to work towards a more data and science literate society.
This resource was developed for Dataspire by Kristin Hunter-Thomson. Kristin has worked in science and science education for over 15 years in various locations around the U.S. and abroad. She pulls from her middle/high school science teaching background, her experience in formal and informal education, and her training in marine science to oversee the growth and development of Dataspire, an initiative of Rutgers Cooperative Extension. She is also a Teaching Instructor for the Science Communication minor at Rutgers University.
All data interactives are presented using CODAP, an open online data analysis visualization tool developed by the Concord Consortium, learn more here.
Educator's Toolbox
Meet the Writer
About Dataspire
@ru_dataspireDataspire is an initiative of Rutgers Cooperative Extension that facilitates professional development training and develops data resources to work towards a more data and science literate society.