Grade Level
6 - 8
minutes
15 min - 1 hr
subject
Mathematics
Activity Type:
These redistricting puzzles are kind of like Sudoku. They’re also a lot like the political practice of gerrymandering. Have fun.
One of the basic underpinnings of U.S. democracy is that we use voting to determine who represents us at the city, state, and federal levels of government. The U.S. Congress—that collection of 100 senators and 435 voting representatives that gather in Washington, D.C. to create and vote on things like laws, taxes, wars, and budgets—is the primary institution that gives voters representation in the federal government.
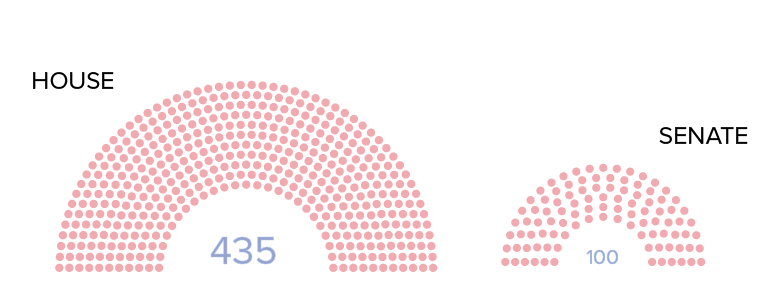
While each state is represented by exactly two senators (50 x 2 = 100), the nation’s 435 voting representative seats in congress are allocated to states according to the size of each state’s population—more representatives go to states with larger populations, and a minimum of one representative goes to states with small populations, like South Dakota and Vermont. This process is called apportionment, and is carried out by congress every 10 years from data collected during each U.S. Census.
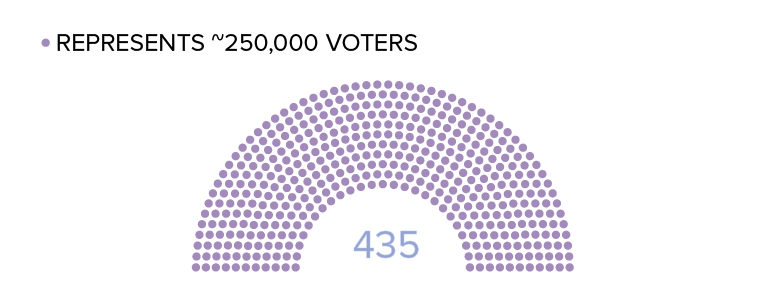
States with more than one representative are responsible for dividing the state into congressional districts, or regions of the state that vote for a single congressional representative. States use census data about the distribution, number, and kinds of voters in the state to determine voting district boundaries after each federal apportionment.
Now how does one go about drawing those districts? And are district maps always fair to the voters they are meant to represent? In short, lots of different mapping tactics are used for redistricting, and no, the U.S. Supreme Court has found that many of the resulting maps are unconstitutional and discriminatory in nature.
[Want to connect with fellow STEM educators? Join in on the discussion in SciFri’s Educator’s Lounge!]
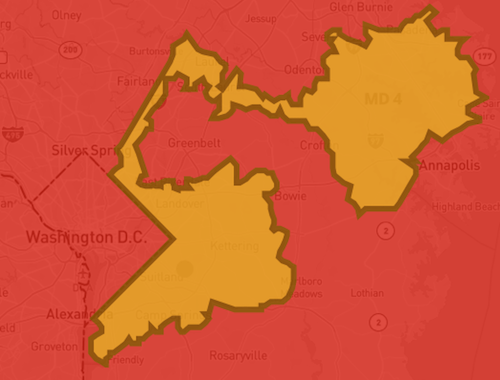
In 2017 alone, the U.S. Supreme Court heard cases against the states of Virginia, Alabama and North Carolina following redistricting informed by the 2010 census. Each of the states was accused of drawing “packed” districts based on the race of voters, thus diminishing the power of their votes. This practice of strategic redistricting is called gerrymandering, and can be generally defined as the practice of drawing district lines to ensure that a specific political party, racial minority, or other interest group is disadvantaged in local, state, or national elections
In all cases, the court ruled that using race to guide redistricting was unconstitutional. However, whether it is constitutional to draw districts so that one political party has an advantage over another remains to be determined. As of this writing, the U.S. Supreme Court has yet to rule on Gill v. Whitford, a case that will determine whether gerrymandering based on the political party is something that the U.S. Supreme Court can pass judgment on, and if so, whether it is permitted under the U.S. Constitution.
Now comes the fun part. Let’s do some redistricting puzzles! In this activity, you’ll be challenged with a series of district-drawing puzzles, each of which is designed to convey a redistricting rule or practice. Just like real redistricting, every one of these puzzles has more than one correct solution.
So grab a pencil, print out a Redistricting Challenges Sheet, and get scrolling. Here we go.
Redistricting 101
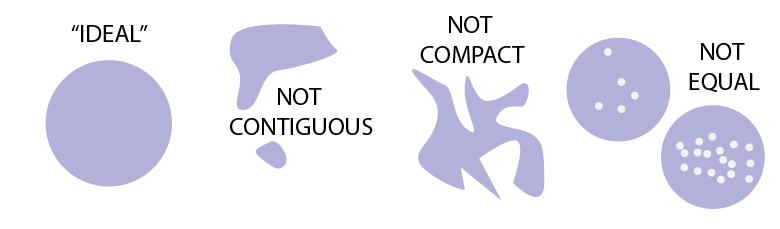
Every state does redistricting a little bit differently, but there are some general rules that most states use to guide the process. The rules are the same whether you’re an elected member of the state legislature in Oregon, part of an appointed commission in Montana, or part of an independent nonpartisan redistricting commission in the state of California. If you are responsible for redistricting, you should adhere to three traditional principles: contiguity, compactness, and population equality.
For these challenges, you will be charged with adhering to one of the three traditional redistricting principles as you draw districts in simplified “states.” Many state laws offer guidelines about how to “draw within the lines” to maintain pre-existing communities of interest, jive with natural topography like rivers and mountains, and stay within county or state lines. In that spirit, you may only draw districts by tracing along the gray lines in the following challenges.
Good luck!
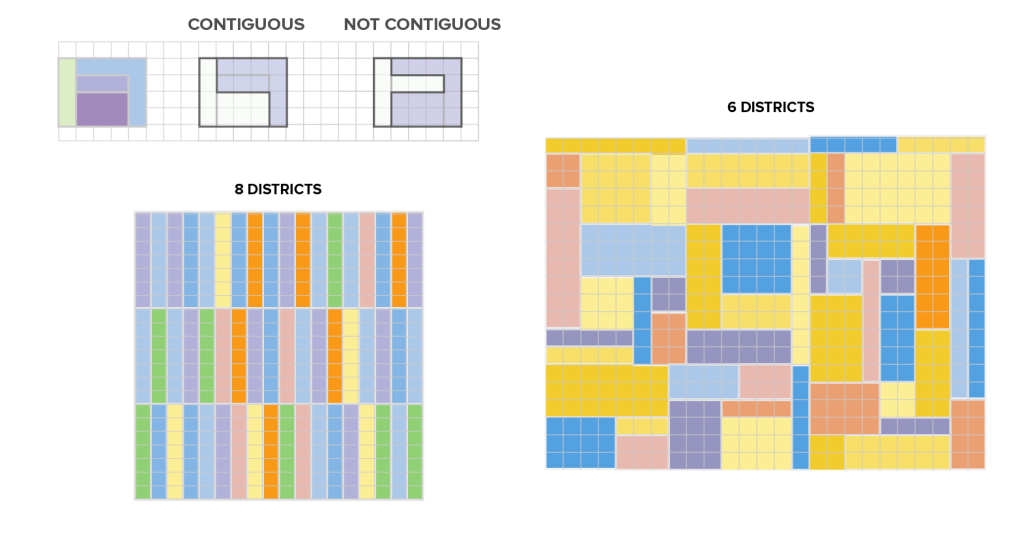
Challenge 1: Contiguity
In many states, redistricting requires that all parts of a district have to be connected to one another, or “contiguous.” Separation by water is allowed, so islands can glom onto the nearest mainland district. Experts generally agree that a district is NOT contiguous if parts of it are barely touching or connected to one another by thin lines. Contiguity is a simple step to fairness of representation by ensuring that voters in a district have at least one thing in common—they are relatively near to one another.
Divide each of the following states into the assigned number of contiguous districts, without dividing blocks of squares that are the same color. Make sure that all parts of a district are touching one another by segments at least two squares wide
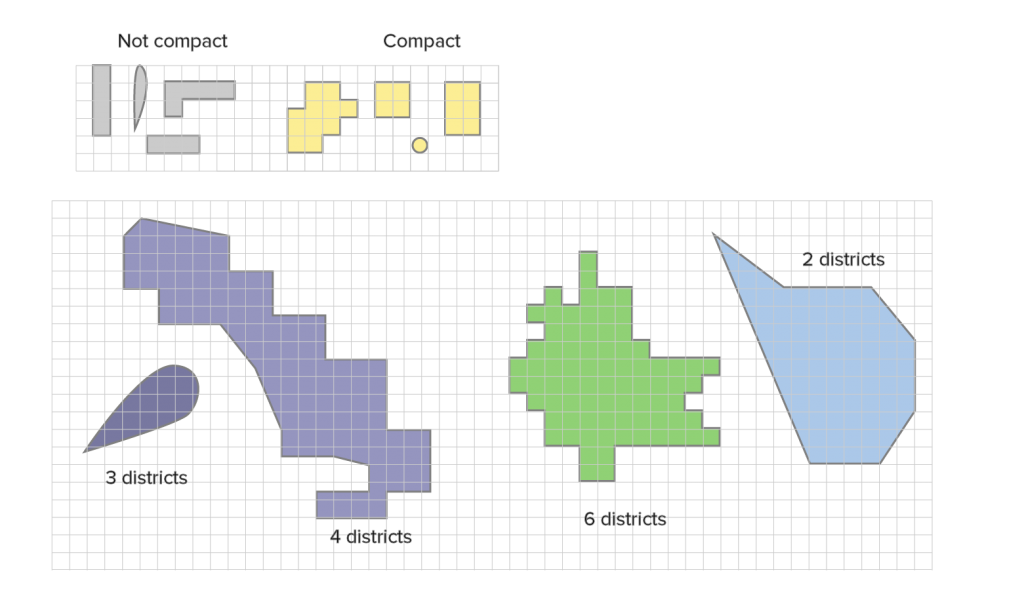
Challenge 2: Compactness
An ideal district should be convex and compact, not long and thin (“dispersed”), or have any projections or dents (“indentations”) in it. In other words, an ideal district should be more like a circle, square, or polygon, and less like a hot dog, salamander, or star. This is another way of guaranteeing some amount of proximity between voters of the same district, while also guarding against too much “creativity” when redistricting to bias election outcomes.
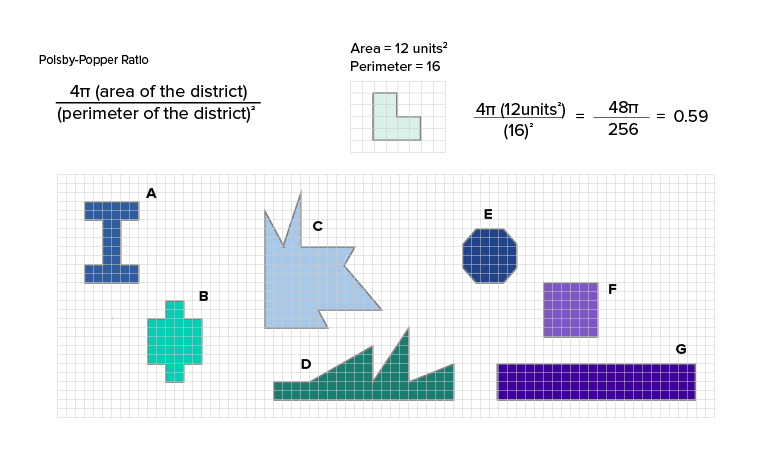
There are many mathematical ways to measure geometric compactness of districts that take the shape of formulas or equations, often named for their creators (e.g. Polsby-Popper, Boyce-Clark, Reock) or how they are measured (e.g. “convex hull,” “length/width ratio”).
- Part 1: Draw compact districts with a length/width ratio greater than 0.5.
The length/width ratio is the simplest measure of compactness. Compact shapes (whether square or circle), have a length/width ratio close to or exactly one. The further the length-to width ratio is from one, the less compact. Your challenge is to divide each of the following states into the assigned number of districts so that no district is more than two times as long (or tall) as it is wide.
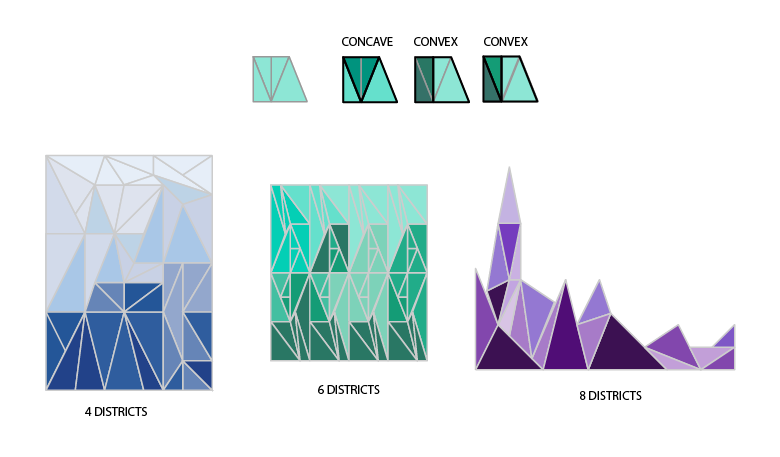
- Part 2: Design districts that are convex.
Compact shapes are by definition convex, meaning that they do not contain any indentations or protuberances. Following the provided lines (analogies for populations of interest, geographic features, or other pre-existing boundaries), divide the following states into the assigned number of districts, so that all states are convex and contain no indentations or projections.
- Part 3: Rank the following districts by compactness as measured by the Polsby-Popper ratio. The Polsby-Popper ratio is a measure of geometric compactness that measures the closeness of a district to the shape of a (maximally compact) circle. Districts with a Polsby-Popper ratio closer to one are more compact. The expression for the Polsby-Popper ratio requires that you know each district’s perimeter and area, and looks like this:
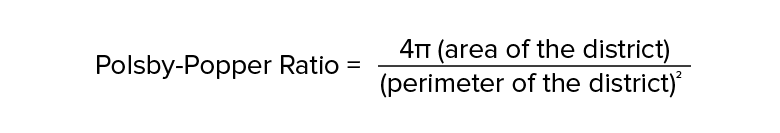
Rank the following districts according to their Polsby-Popper ratio from most to least compact.
Challenge 3: Population Equality
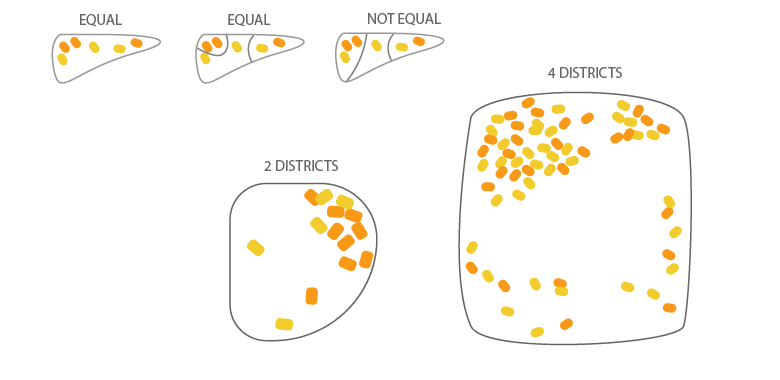
In a fair state, every district should contain about the same number of voters. This ensures that no vote is more valuable than any other in determining the outcome of an election. Divide each of the following states into the assigned number of districts so that each district has an equal population size.
- Part 1: Rural dispersed scenario
In this scenario voters live in equal, if low, density throughout the state.
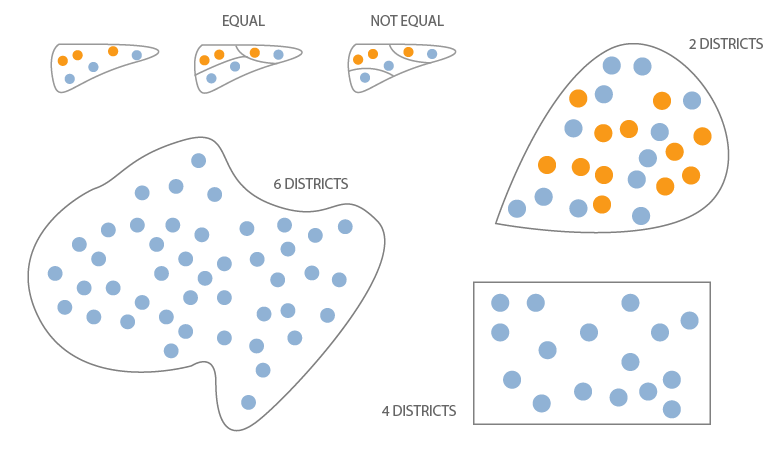
- Part 2: Urban, rural, suburban states
This scenario is more realistic; voters live in different population densities throughout the state.
Challenge 4: Fairness
![]() Ideally, the outcomes of district elections would mirror the political and social interests of the state population as a whole. Most states don’t have explicit laws about this ideal, but many recent and historical cases have been brought to the Supreme Court on the grounds that the U.S. Constitution protects this premise.
Ideally, the outcomes of district elections would mirror the political and social interests of the state population as a whole. Most states don’t have explicit laws about this ideal, but many recent and historical cases have been brought to the Supreme Court on the grounds that the U.S. Constitution protects this premise.
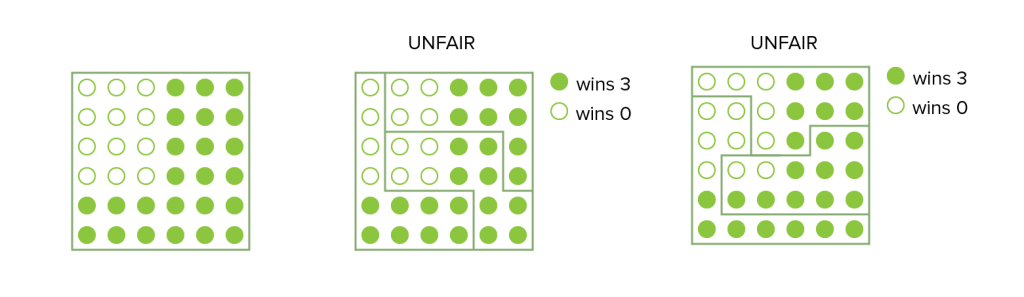
In the imaginary state to the right, there are 36 voters that must be divided into three districts with 12 voters in each district. This state, like all states, contains voters who tend to vote a certain way on key issues or political party candidates. In this imaginary state, 12 of the voters are open circle voters (1/3 of the population), and the other 24 are filled-circle voters (2/3 of the population). In order to win a district, voters of one type must make up the majority (7 or more) of the voters in a district.
With fair redistricting, the outcome of an election in this state should reflect the ratio of open to filled-circle voters. open-circle voters should win one of the three districts, and filled-circle voters should win the other two.
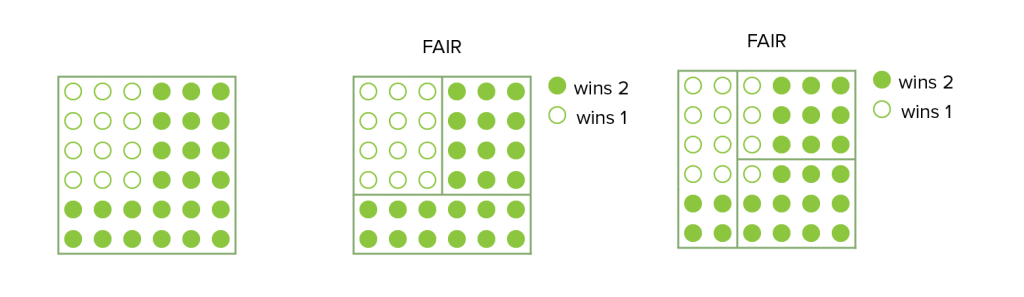
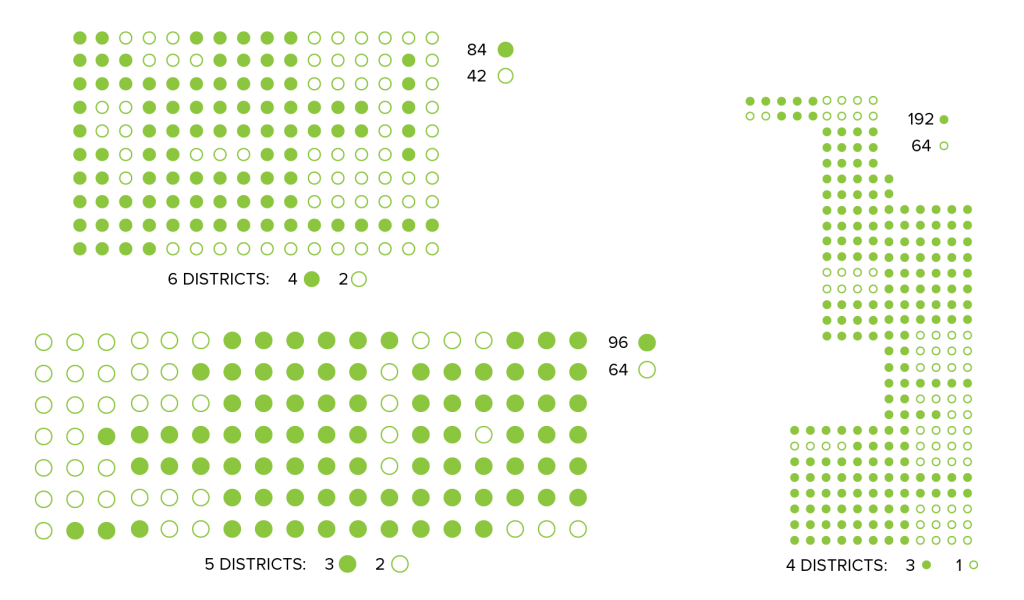
Your challenge is to draw fair districts for each of the following imaginary states, where each dot represents a block of 10,000 voters. For each state, the number of districts and the ideal voting outcome is indicated. open-circle voters are in the minority in each state. As you draw your districts, make sure that you follow the principles of population equality, compactness, and contiguity.
Gerrymandering Puzzles
In the first series of puzzles, you practiced redistricting for fairness and tradition. For these puzzles, you must try to draw your districts to increase the influence of one group of voters over the other, helping them win more districts in future elections. This process of manipulating district boundaries to give an advantage to a specific party or group is called gerrymandering.
For an example of gerrymandering, let’s go back to our small example state where one third of voters are open-circle voters and the other two thirds of voters are filled-circle voters. It’s possible to draw districts so that open-circle voters could never achieve a majority, thus ensuring that open-circle voters are not represented in the outcome of district voting. Here’s what that could look like:
The following puzzles challenge you to redefine district boundaries using one of three common gerrymandering approaches: cracking, packing, or stacking. Here are the new rules:
- Like most (but not all) elections, these puzzles assume a winner-take-all election, meaning that in any given district, the party or candidate with the most votes wins the entire district.
- You must still preserve population equality between districts.
- As a “gerrymanderer,” you should feel free to ignore compactness.
- Districts in gerrymandering states are contiguous even if parts of a district are only connected by a single square or are touching at the corners. In other words, districts don’t really have to be contiguous.
You’ll use the same three states you used in the fairness challenges above, with the same requirements for district number. But this time, your goal is to gerrymander the new district lines to alter voting outcomes in the state to favor one of the two voter types.
Cracking Puzzle
Split the clusters of voters into different districts so that the filled-circle voters have a majority in every district.
Cracking Analysis:
- Was it easier or harder to draw unfair districts compared to fair districts? Why?
- How do the shapes of your gerrymandered districts vary compared to the ones you drew fairly? Are they compact? Are they contiguous by at least two squares?
Packing Puzzle
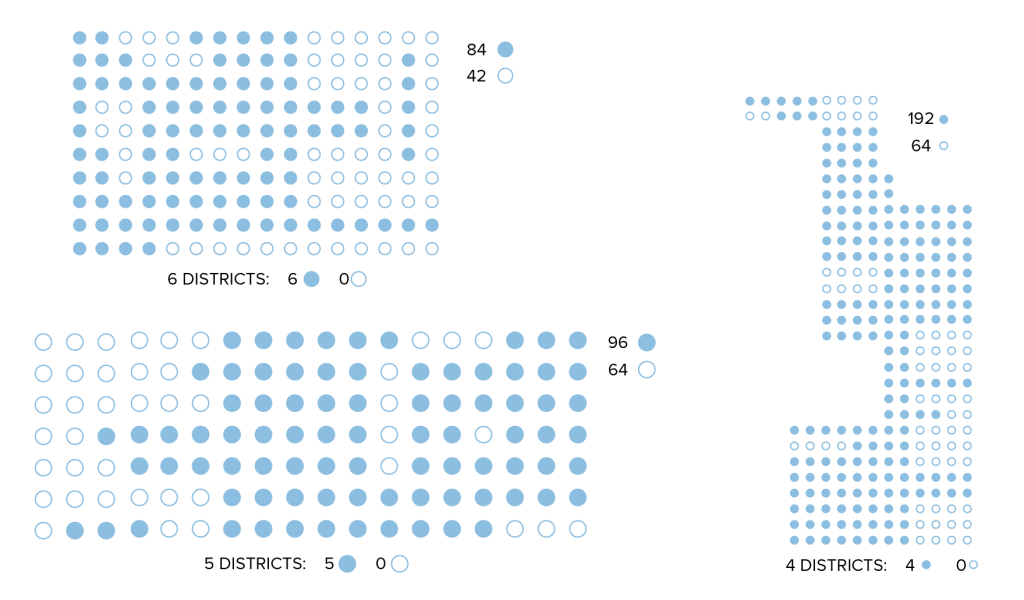
Try to pack the groups of open-circle voters into one or two districts, so that filled-circle voters win more districts than they should under a fair redistricting plan.
Packing Analysis:
- Were you able to use packing to effectively create unfair voting outcomes for all of these districts?
- Which imaginary states were easy to gerrymander using packing, and which ones were more difficult?
- Based on your gerrymandering, are there distributions of voter populations in some states that make them more vulnerable to unfair gerrymandering practices?
- Was it easier or harder to draw unfair districts with packing or cracking? Was that true for all states?
- How do the shapes of your packed districts differ from the ones you drew fairly? What about compared to the ones you gerrymandered using cracking?
Stacking Puzzle
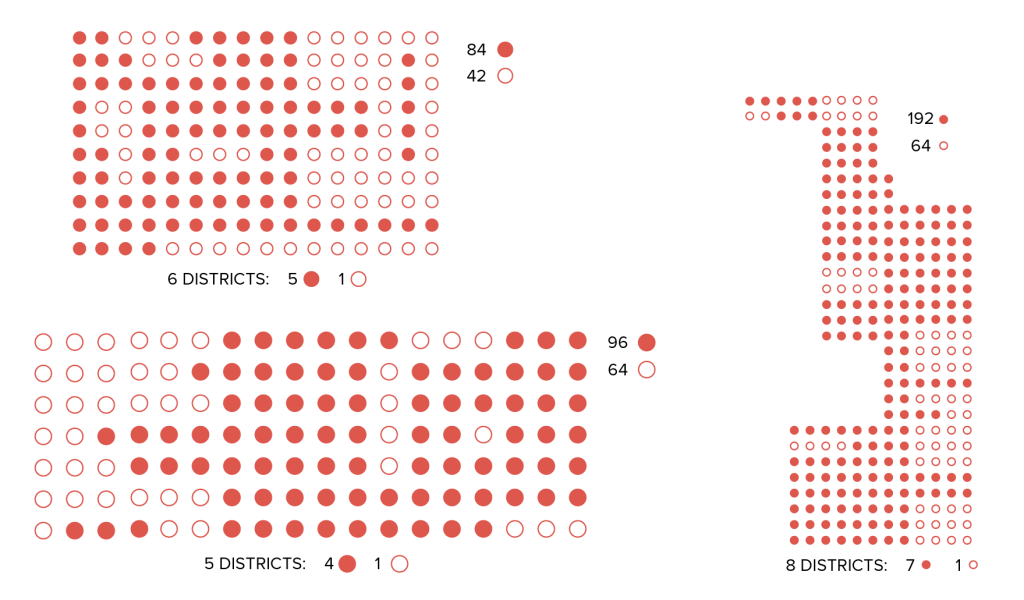
You must “stack the deck” in favor of the minority open-circle voters. Create districts so that open-circle voters, who are in the minority, win more districts than they would if the lines were drawn fairly.

Stacking Analysis:
- Were you able to use stacking to give open-circle voters an unfair representation in voting outcomes? Were there any states where this was difficult or impossible?
- Were some states easier to stack than others? What about the distribution of voters made a state easier to stack?
- Do you think the voting outcomes from your stacked maps are as unfair as the ones you drew by packing and cracking? More so? Why?
- How do the shapes of your gerrymandered districts using stacking vary compared to the ones you drew fairly? What about the ones you gerrymandered using cracking and packing?
- Do you think it would be possible to use district shapes to help you determine whether a state had gerrymandered its districts by stacking, packing, or cracking? How? What would you look for?
Final Gerrymandering Challenge: Real Districts
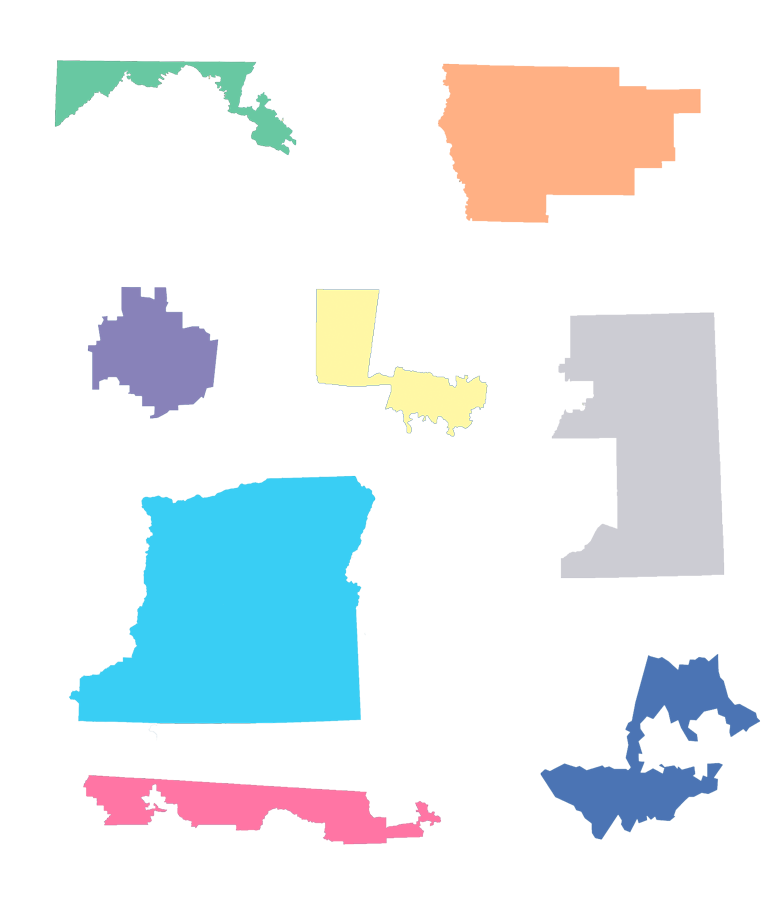
As you discovered in your gerrymandering puzzles, gerrymandered districts tend to look weird because they are often neither compact nor contiguous. Take a look at the following series of 8 districts taken from real states from the 115th congressional district map. Experts in the fields of political science, statistics, and sociology have deemed four of these districts as some of “the most gerrymandered” districts in the United States, in part because they are the least compact. Can you guess which ones may have been gerrymandered?
Districts like the ones above present new puzzles for state and federal courts who must decide whether a state’s redistricting plan is fair or unconstitutional. Is there a way to tell whether districts were drawn to intentionally disadvantage voters of a certain race, political party, or religion? Is it possible to make a rule or law that can be applied consistently to districts to determine if districts have been unfairly gerrymandered? Oliver Roeder, senior writer at FiveThirtyEight, and Moon Duchin, associate professor of mathematics at Tufts University joined Science Friday to describe one potential measure of fairness called the “efficiency gap,” and the challenges and opportunities for getting justices to use math to judge district fairness.
Does Math Have A Place In The Courtroom?
In Reality, Gerrymandering Is Like This, But Harder.
Gerrymandering is quite old. The term “gerrymander” was coined to describe a peculiar salamander-shaped district created by Massachusetts Governor Elbridge Gerry (pronounced with a hard “g,” like Gary) who pioneered the practice back in 1812.
Since then, gerrymandering has grown both increasingly common and complex with higher quality voter data, advanced mapping software, and machine learning. Consequently, detecting where gerrymandering has occurred, determining whether it is discriminatory in nature, and figuring out how it has influenced elections have all become increasingly difficult.
Additional Information:
- The Atlas Of Redistricting, 2018 FiveThirtyEight
- Gerrymandering, Explained, 2015 Vox
- Everything You Always Wanted To Know
About Redistricting But Were Afraid To Ask, 2010 ACLU - How to Quantify (and Fight) Gerrymandering, 2017 Quanta Magazine
- Does Math Have A Place In The Courtroom?, 2017, Science Friday
Credits
Teachers who field tested this resource had the following advice for teachers adopting this resource:
Michelle from Ohio says: If this is a new topic for the learners, it would be beneficial to review new vocabulary beforehand.
Resource and illustration by Ariel Zych
Editing: Xochitl Garcia, Ariel Zych, and Johanna Mayer
Digital Production: Johanna Mayer
If you have questions about this resource or would like to share your experience using it with students, please e-mail us at educate@sciencefriday.com or tweet to @scifri.
Educator's Toolbox
Meet the Writer
About Ariel Zych
@arieloquentAriel Zych is Science Friday’s director of audience. She is a former teacher and scientist who spends her free time making food, watching arthropods, and being outside.